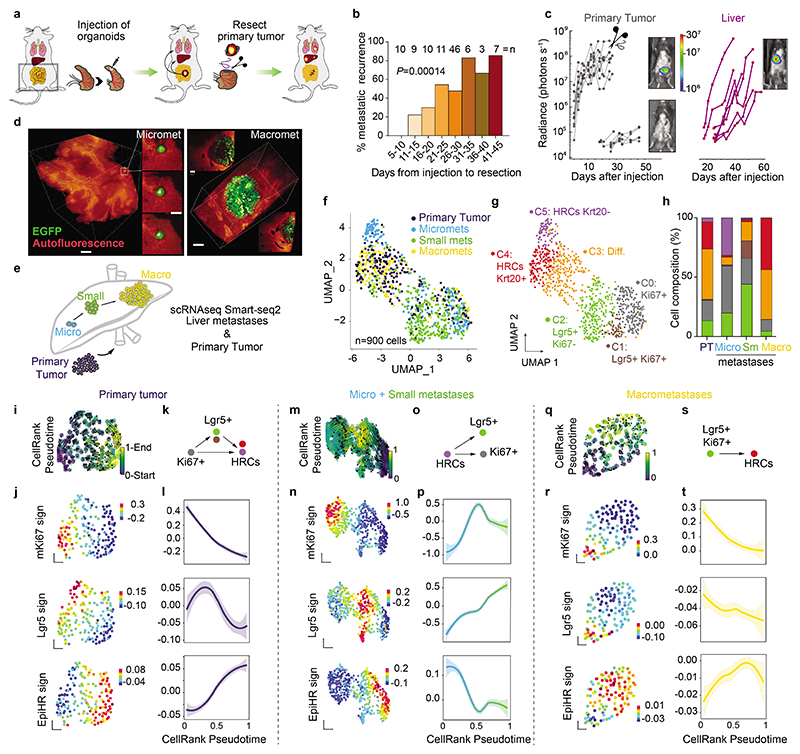
Fig. 2 |. Spatiotemporal dynamics of CRC metastases resolved by scRNAseq.
a, Schematic representation of the mouse model of CRC metastatic relapse developed herein. b, Percentage of metastatic recurrence depending on time to primary tumor resection. Number of mice are detailed above the barplot. P-value for generalized linear model. c, Intravital bioluminescence imaging (BLI) quantification (photons s-1) of a representative experiment. Grey points and lines represent bioluminescence in the lower thorax of individual mice and purple points in the liver. Representative images of bioluminescence in the same mouse before, after surgery and upon liver metastases formation are shown. d, Representative images of whole livers containing GFP-expressing tumor cells obtained using lightsheet microscopy. Scale bars, left image (300 μm on Maximum Intensity Projections (MIP, and selected single plane insets 50 μm); right (100 μm on MIP and single plane insets 50 μm). e, Illustration of the longitudinal single cell RNA-expression analysis of tumor cells along the metastatic cascade. f, g, UMAP layout of 900 tumor cells isolated from 7 different mice colored by (f) metastatic stage and (g) Seurat clusters. h, Barplot showing Seurat cluster composition by sample stage. i, m, q, Vector fields representing RNA velocity projected on UMAPs of primary tumors (i), micro + small metastases (m) and macrometastases (q). Colored by the pseudotime estimated for each cell with scVelo. j, n, r, UMAPs with cells separated in primary tumors (j), micro+small metastases (n) and macrometastases (r) and colored by gene expression of mKi67, Lgr5 and EpiHR gene signatures. k, o, s, Schematics showing distinct hierarchical behavior during the different stages of metastasis formation. l, p, t, Smoothed mKi67, Lgr5 and EpiHR gene signature expression trends fitted with Generalized Additive Models as a function of pseudotime in primary tumors (l), micro+small (p) and large metastases (t).

