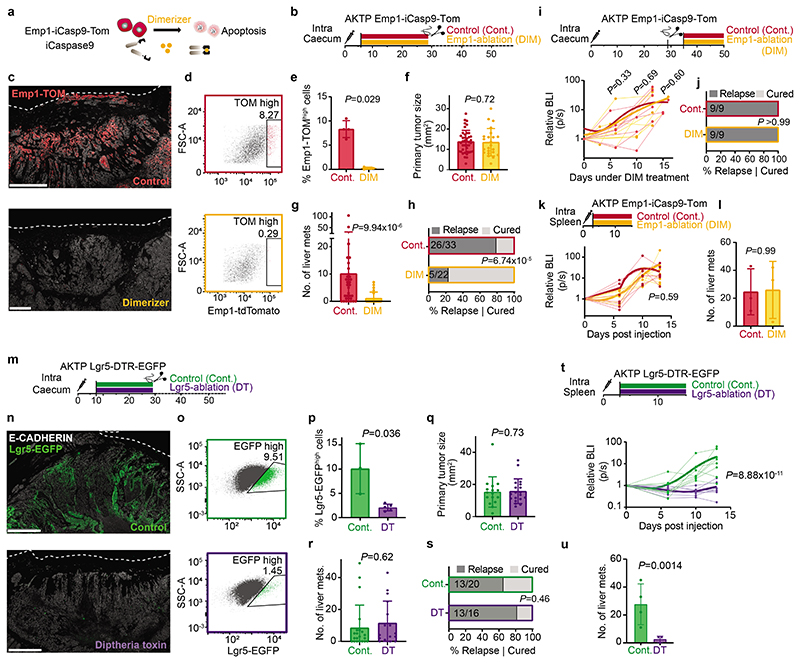
Fig. 4 |. Emp1-high cells are the origin of metastatic relapse.
a, Emp1-iCaspase9-mediated cell ablation. b, Experimental timeline detailing inducible Emp1+cell ablation and surgery. c, Emp1-TOM+ cells in primary tumors after ablation. Lines mark the caecum borders. Scale bars, 500 μm (C), 250 μm (C’). d, Representative flow cytometry plot of TOM fluorescence in EPCAM+ cells. e, Percentage of Emp1-TOMhigh tumor cells (mean ± SD) at the time of surgery. Every dot is a mouse, n=4 in both groups. Two-sided Wilcoxon test. f, Primary tumor area (mean ± SD) after resection. Each dot is a mouse, n= 33 (control) and 22 (DIM) mice. P-value for linear model after boxcox transformation. g, Liver metastases (mean ± SD) at experimental endpoints. Each dot is a mouse, n as in panel f. h, Percentage of mice that relapse with liver metastases. Two-sided fisher test. i, Experimental timeline detailing late ablation of Emp1+ cells and metastatic growth by BLI monitoring. n=9 mice per each group. j, Percentage of mice that relapse with liver metastases. Two-sided fisher test. k, Metastatic growth by BLI monitoring upon ablation of Emp1 cells 3 days after intrasplenic inoculation of Emp1-iCasp9-Tom organoids, n= 3 mice per each group. l, Number of liver metastases in k. Mean ± SD. n= 3 mice per group. m, Experimental timeline. n, Representative stainings of Lgr5-DTR-EGFP+ cells in primary CRCs. Dashed lines outline the serosa. Scale bars, 100 μm. o, Representative flow cytometry plot of Lgr5-EGFP fluorescence. p, Percentage of Lgr5-GFPhigh tumor cells (mean ± SD). n=3 (Cont.) and 5 (DT) mice respectively. P-value for generalized linear model. q, Primary tumor area (mean ± SD) measured after resection. n=20 mice in control and 16 in DT. Two-sided Wilcoxon test. r, Liver metastases (mean ± SD) at experimental endpoints. Each dot is a mouse, n as in (r). s, Percentage of mice that relapse with liver metastases. Two-sided fisher test. t, Liver metastasis growth monitored by BLI after intrasplenic inoculation of MTOs. u, Number of liver metastases (Mean ± SD) in (t). n=7 mice in control and n=8 in DT treated in (t,u). Points and lines of BLI measurements in panels i, k and t, represent individual mice, trend lines (bold) show a LOESS model and P-values were calculated with mixed effects linear model. P-values comparing in panels g, r, l and u were calculated using generalized linear model.

