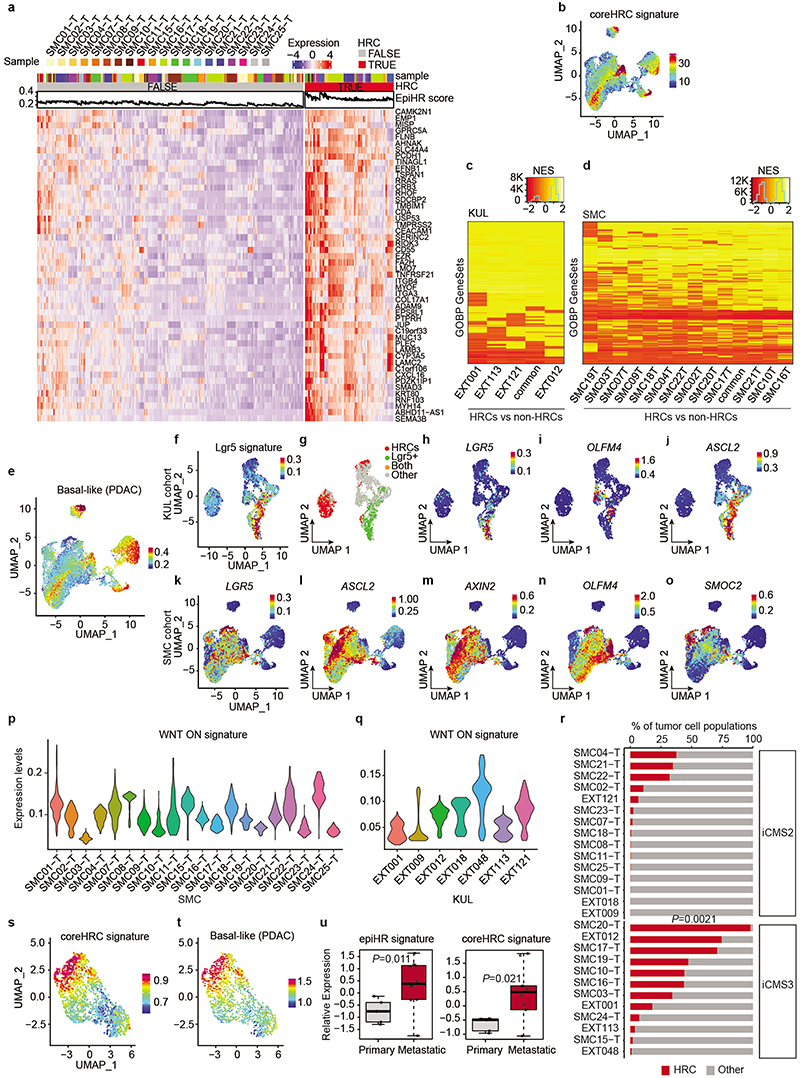
Extended Data Fig. 2 |. Characterization of HRC features.
a, Heatmap showing scaled expression of the top 50 most correlated genes with the EpiHR signature across SMC patients. Tumor cells are divided as non-HRCs (left, FALSE) and HRCs (right, TRUE). The EpiHR signature score for each individual cell is plotted above the heatmap. b, UMAP layout of CRC tumor cells colored by the expression of the coreHRC signature. The coreHRC signature is defined as the top 100 genes with better correlation with the EpiHR signature. c-d, Heatmap showing Normalized Enrichment Scores (NES) for Genesets in Gene Ontology Biological Processes (GOBP) in HRCs from different patients in the KUL (c) and SMC (d) cohorts. Only GOBP genesets with NES scores above 0.5 are shown. Genesets and patients are ordered by hierarchical clustering. e, UMAP layout of human CRC tumor cells in the SMC cohort painted with the Basal cell state signature in Pancreatic Ductal Adenocarcinoma (PDAC) by Raghavan et al10. f, UMAP layout of tumor cells from the KUL cohort showing the expression of the Lgr5 signature. g, UMAP of same tumor cells labelled according to their classification into HRCs, Lgr5+, double positive or other cells. h-j, UMAP layout of same tumor cells showing gene expression levels of canonical intestinal stem cell genes LGR5, OLFM4 and ASCL2. k-o, UMAPs of tumor cells in the SMC dataset showing gene expression levels of canonical intestinal stem cell genes LGR5, ASCL2, AXIN2, OLFM4, and SMOC2. p,q, Violin plots showing WNT-ON signature expression levels in epithelial tumor cells from patients in the SMC (p) and KUL (q) cohorts. r, Barplot quantifying the HRC composition of each patient (combined SMC and KUL datasets). Patients are classified as iCMS2 or iCMS3 according to Joanito et al11. Two-sided Kruskal-Wallis test. s,t, UMAPs of mouse CRC AKTP tumor cells colored according to (s) the coreHRC signature and (t) the Basal cell state signature in Pancreatic cancer by Raghavan et al.10 u, Gene expression levels of EpiHR (left) and coreHRC (right) signatures in MTOs derived from primary tumors or from liver metastases. Boxes represent the first, second (median) and third quartiles. Whiskers indicate maximum and minimum values. Welch two-sided t-test. n= 5 (primary) 10 (metastatic).

