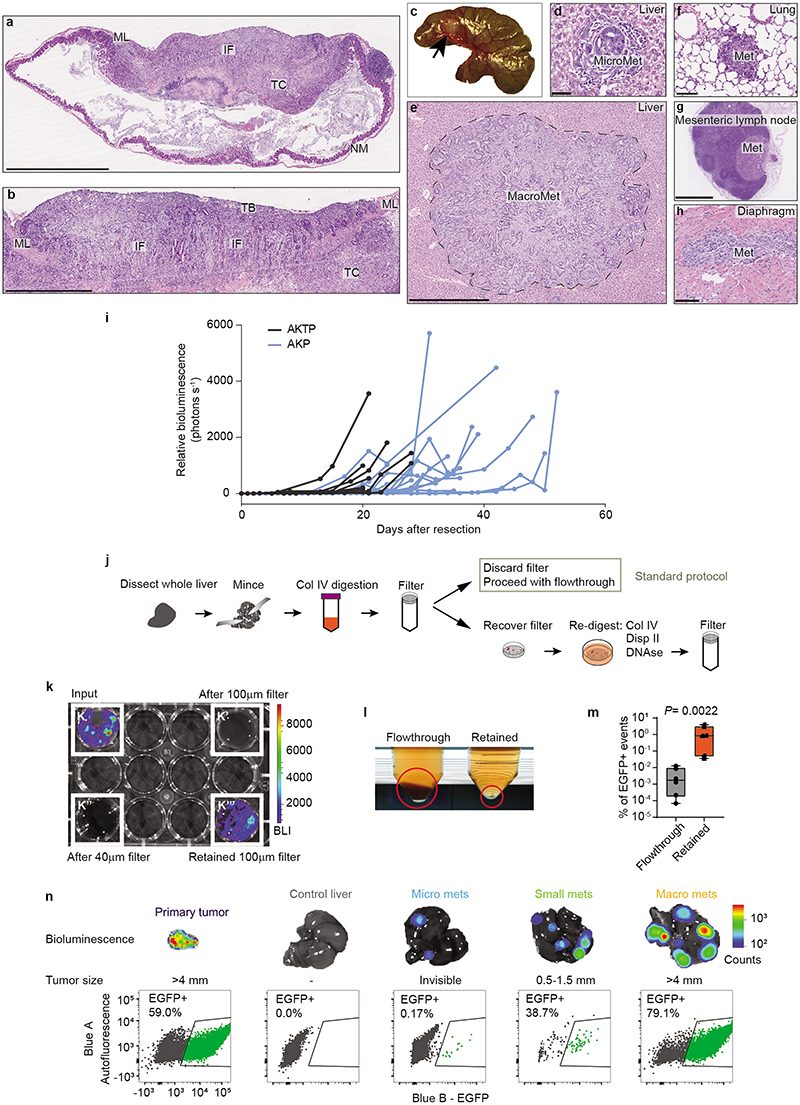
Extended Data Fig. 3 |. Analysis of the CRC relapse mouse models and purification of DTCs.
a, Representative micrograph of hematoxylin- and eosin (HE)-stained adenocarcinoma with subserosal invasion (T4) generated by injection of an AKTP MTO in the mouse caecum. Tumor center (TC), invasive fronts (IF), muscle layer (ML) and normal mucosa (NM) are indicated. Scale bar, 2.5 mm. b, Representative image of a different T4 tumor penetrating the muscle layer (ML) and reaching the serosa layer. TB: Tumor buds. Scale bar, 1mm. c, Picture of a caecum 21 days after injection and imaged at the time of surgery showing a primary tumor (arrow) in the distal part. d-e, Haematoxilin-Eosin (HE) staining of micrometastases and large metastases observed in the liver of orthotopic isografted mouse. Scale bars, 50 μm and 1 mm, respectively. In e, tumoral tissue is surrounded by dashed lines. f-h, HE staining of lung, lymph node and diaphragm metastases from orthotopic isografted mice. Scale bars, 100 μm (f and h) 1 mm (g). i, Graph showing liver longitudinal BLI measurements (photons per second), normalized to the day of primary tumor resection. Points and lines represent individual mice. n= 9 (AKTP), 24 (AKP) mice. j, Schematic representation of a novel tissue-dissociation strategy that enables recovery of DTCs from livers. Whole livers are dissected and minced thoroughly. After a mild collagenase IV digestion, samples are filtered through 100 μm meshes. The filter retained sample is highly enriched in tumor cells. Remaining tissue in the filter is re-digested with a stronger enzymatic cocktail to fully digest it, and then re-filtered. k, Representative bioluminescent image of a whole liver sample containing luciferase+ tumor cells before enzymatic digestion (B, input), after filtering through 100 μm (B’) and 40 μm (B”) meshes (previous protocol), and after recovering and redigesting tissue retained in the 100 μm filter (B”’). l, Image showing the large cell pellet containing liver cells after 1 mild digestion and the small pellet in the retained and re-digested sample enriched in DTCs. m, Percentage of GFP+ cells measured by flow cytometry in samples with 1 round of digestion compared to re-digested samples. Boxes represent the first, second (median) and third quartiles. Whiskers indicate maximum and minimum values. Paired two-sided Wilcoxon test on percentages. n=6 independent paired samples examined in 2 independent experiments. n, Representative bioluminescent images, tumor burden and flow-cytometry plots of the 4 different stages analyzed by single-cell Smart-sequencing described in Fig. 2. Micrometastases samples were DTCs collected from livers with absent or low bioluminescence in which metastases were not visible. For small metastases samples, metastatic nodules were visible but small in size (<1.5mm). Macrometastases samples were metastatic nodules larger than 4mm.

