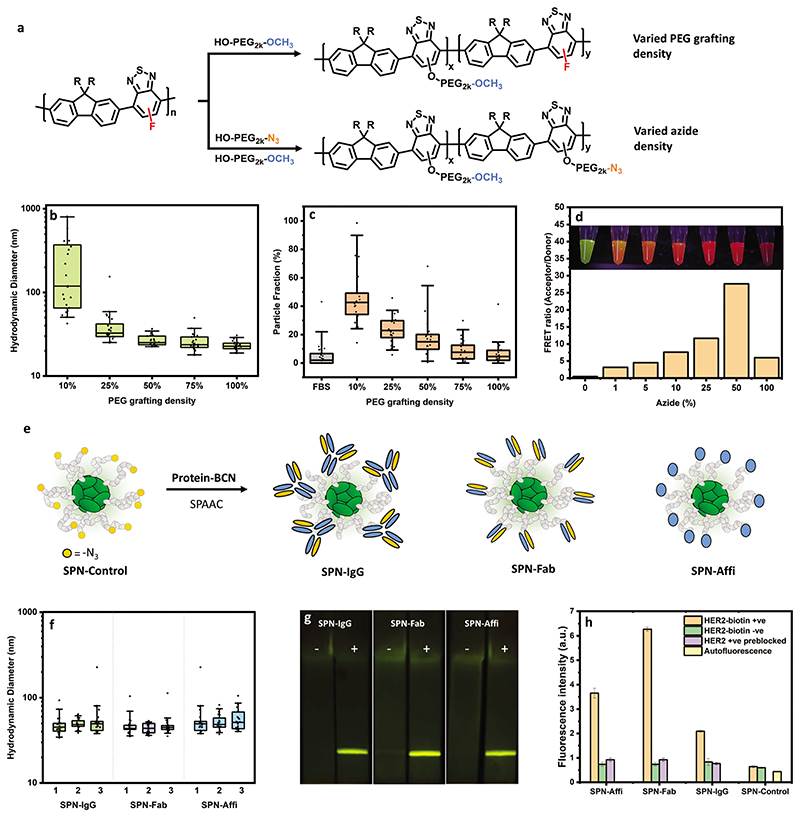
Figure 2. Synthesis and characterization of SPNs with tuned grafting density, azide density, and cancer targeted proteins.
a) Scheme of modification of F8BT-F with varied PEG grafting and azide densities. b) Hydrodynamic diameter of SPNs with a varying PEG grafting density in PBS after 24 h incubation calculated from FCS autocorrelation analysis (n = 25 technical replicates). c) Particle fractions from two-component fits of FCS curves after mixing SPN series with FBS–AF647, revealing extent of protein fouling on nanoparticle surface, with high particle fraction corresponding to high protein binding (n = 25 technical replicates). d) Ratio of acceptor emission (λEm = 630 nm) and donor emission (λEm = 540 nm) of AF594-functionalized particles, as a function of azide-functionalization percentage. Image insets show SPN solution under UV-light exposure (n = 1). e) Scheme for the modification of SPN–PEG2000–N3 with byclonononyne (BCN)-functionalized IgG, Fab, and affibody. f) Hydrodynamic diameter of SPNs in PBST (PBS with 0.05 v/v% Tween-20) calculated from FCS autocorrelation analysis (3 independent particle batches, n = 25 technical replicates for each). g) Images of lateral flow strips (with a polystreptavidin test line) which have been wicked with SPNs with (+) and without (–) HER2 biotin (imaged under blue light (450 nm) with a SYBR-gold filter). h) FLISA fluorescence intensity data (λEx = 450 nm, λEm = 540 nm) of SPNs with and without HER2 biotin, including a blocked HER2 biotin control (data shown as mean ± S.D., N = 1, n = 3 technical replicates. Box plots: 5th and 95th percentile values (top and bottom horizontal lines), the lower quartile (lower boundary of the box), the median (the line inside the box), and the upper quartile (upper boundary of the box).

