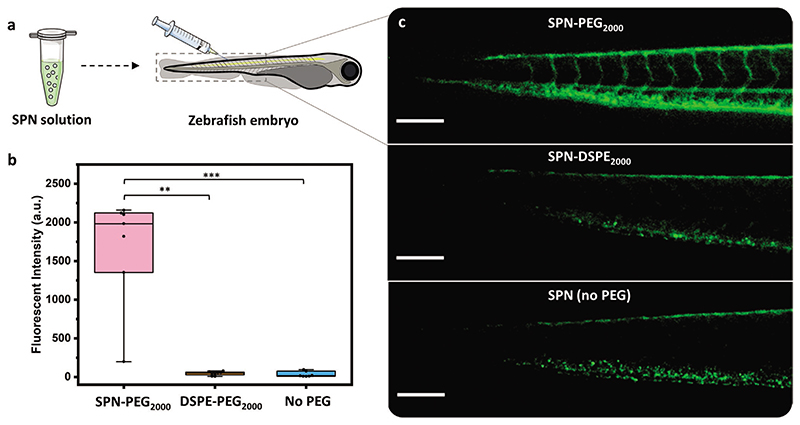
Figure 4. Circulation of SPNs in zebrafish embryos.
a) Scheme of SPN injection into the caudal vein of zebrafish embryos. b) Fluorescence intensity of the circulating SPNs extracted from video analysis 8 h postinjection. n ≥ 7 embryos per group, statistical analysis: Kruskal–Wallis test with post-hoc Dunn’s test, comparison to SPN–PEG2000, **p < 0.01 and ***p < 0.001. c) Representative stereomicroscope fluorescence images of the tail region of zebrafish embryos, 8 h postinjection (scale bar = 200 μm). Box plots: 5th and 95th percentile values (top and bottom horizontal lines), the lower quartile (lower boundary of the box), the median (the line inside the box), and the upper quartile (upper boundary of the box). Figure a) was partly generated using Servier Medical Art, provided by Servier, licensed under a Creative Commons Attribution 3.0 unported license.

