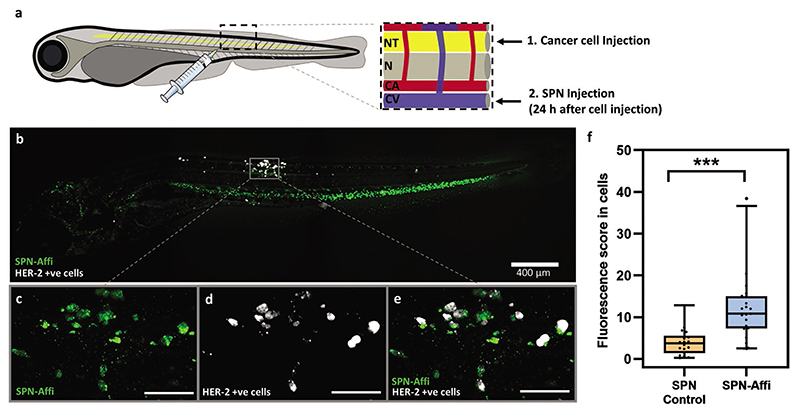
Figure 5. Targeted SPNs in zebrafish xenografts.
a) Schematic representation of cancer cell (pretreated with CellMask deep red stain) and SPN injection (24 h after cancer cell injection) into the zebrafish embryo neural tube (NT) and caudal vein (CV), respectively. “N” and “CA” refer to the natural tube and the caudal artery, respectively. b) Representative confocal image of a zebrafish embryo xenograft 24 h after SPN–Affi injection. c–e) The solid box area is enlarged, showing the fluorescent signal in the confocal slice for SPN–Affi, cancer cells, and SPN–Affi/cancer cells combined, respectively (scale bar = 100 μm). f) Quantification of the average fluorescence intensity from 3D reconstruction images of SPN–Affi and SPN-Control inside cancer cells (n ≥ 18 embryos per group). Statistical analysis: Kolmogorov–Smirnov test, comparison to SPN-Control, ***p < 0.001. Box plots: 5th and 95th percentile values (top and bottom horizontal lines), the lower quartile (lower boundary of the box), the median (the line inside the box), and the upper quartile (upper boundary of the box). Figure a) was partly generated using Servier Medical Art, provided by Servier, licensed under a Creative Commons Attribution 3.0 unported license.

