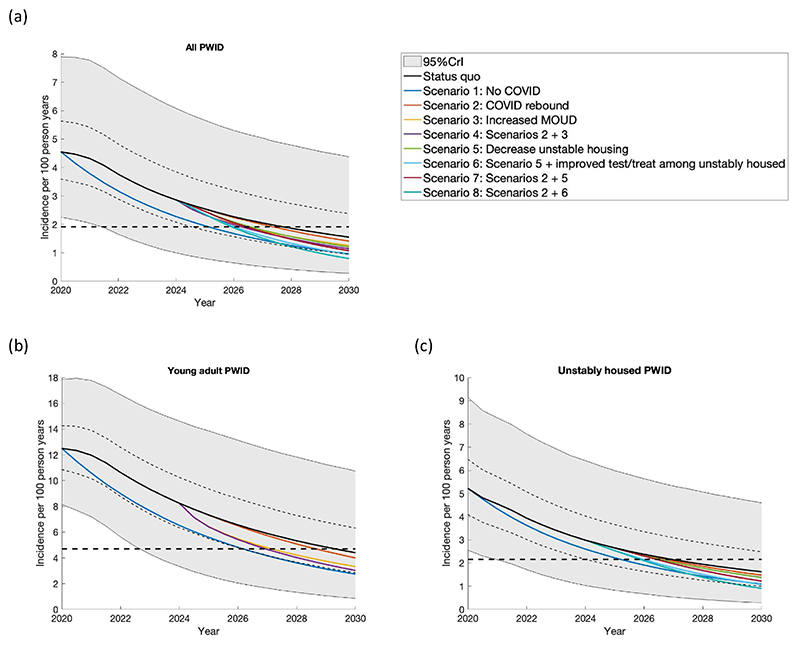
Fig. 3.
The projected impact of different intervention scenarios from 2024 to 2030 on HCV incidence among (a) all PWID, (b) YPWID aged < 30 years and (c) unstably housed PWID. MOUD is assumed to start in 2000. Incidence is estimated among susceptible PWID. Each panel shows the median of the baseline model fits and their interquartile range and 95% credible interval (solid black line, thin dashed lines and shaded grey area) and different scenarios related to the specific subgroups. The black dashed line in each figure represents the WHO elimination goal of an 80% reduction in the median modelled HCV incidence since 2015. Scenarios are: Status quo: Continuing with testing and treatment as during COVID; Scenario 1: Counterfactual of no change in testing and treatment over March 2020 to present; Scenario 2: Rebound in the testing and treatment levels to pre-COVID levels by 2025 among all PWID (reversing the 59.1% decrease that was seen due to COVID); Scenario 3: Increase in MOUD levels in 2024 among YPWID (from 25.5% (14.3–39.6%) accessing MOUD in the last 12 months to 46.1% (39.3–53.0%), the same as among PWID aged 30–49); Scenario 4: Scenario 2 plus Scenario 3; Scenario 5: Decrease in unstable housing levels by 2025 among all PWID (from 87.5% to 73.8% (69.5–77.8%)); Scenario 6: Scenario 5 plus increase HCV testing and treatment levels in 2024 among unhoused PWID; Scenario 7: Scenario 2 plus Scenario 5; and Scenario 8: Scenario 2 plus Scenario 5 plus Scenario 6.

