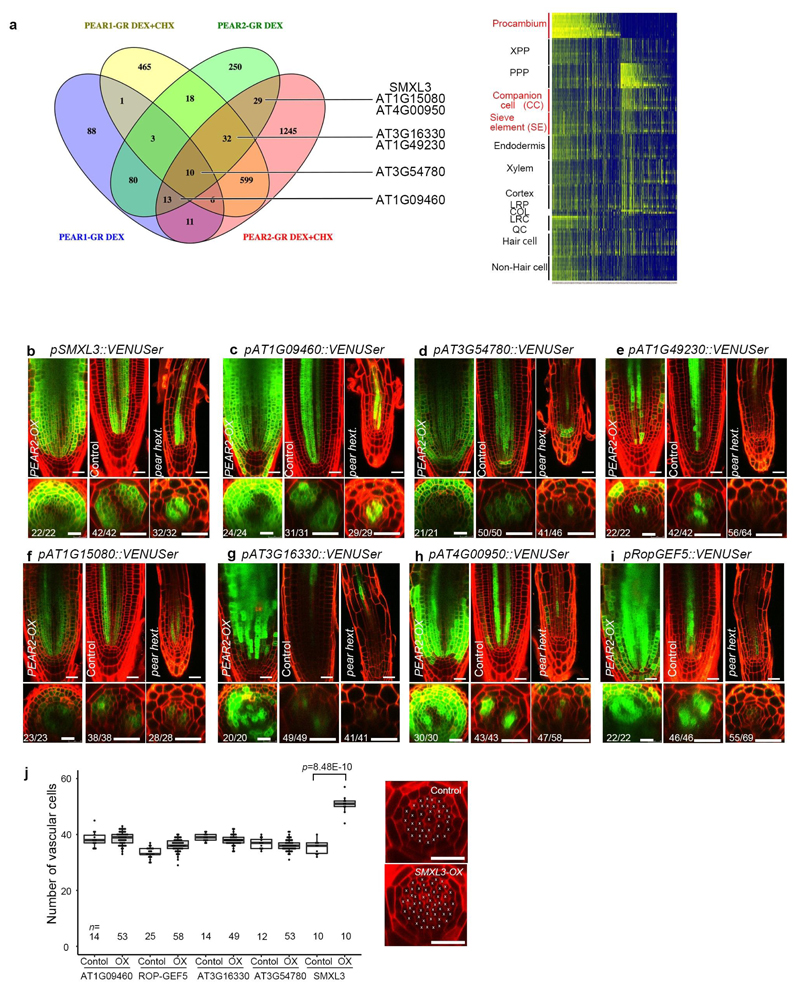
Extended Data Fig. 6. Identification of genes acting downstream of PEAR.
a, Venn diagram showing the genes upregulated by overexpression of PEAR1 or PEAR2 with and without cycloheximide (chx). The analysis revealed 212 and 435 upregulated genes, in the respective experiments. Heatmap showing the predicted spatiotemporal expression patterns of all genes induced by PEAR1 or PEAR2. b-i, Expression patterns of eight selected genes responding to PEAR2 overexpression. In control conditions, all genes exhibit a broad expression pattern, in which five of them are transcribed both in phloem and procambial cells (b-d and i), and the rest of them are in PSE and its surrounding cells where PEAR proteins are accumulated abundantly (e-h). Whereas expression of SMXL3, AT1G09460 and AT1G15080 are maintained even in pear hextuple (b, c, f), the expression level of five genes are attenuated (d, e, g-i). Number in each panel indicates samples with similar results of the total independent biological samples analysed. j, Number of vascular cells after 3-days induction of overexpression of each PEAR downstream gene. In each case, several lines were analysed in parallel for a phenotypic change. Only SMXL3 overexpression can increase the vascular cell number (confirmed in three independent lines). Boxplot centres show median. For more information on boxplots, see Methods. n represents independent biological samples. Dots, individual data points. P value was calculated by two-sided Student’s t-test. Scale bars represent 25 μm.

