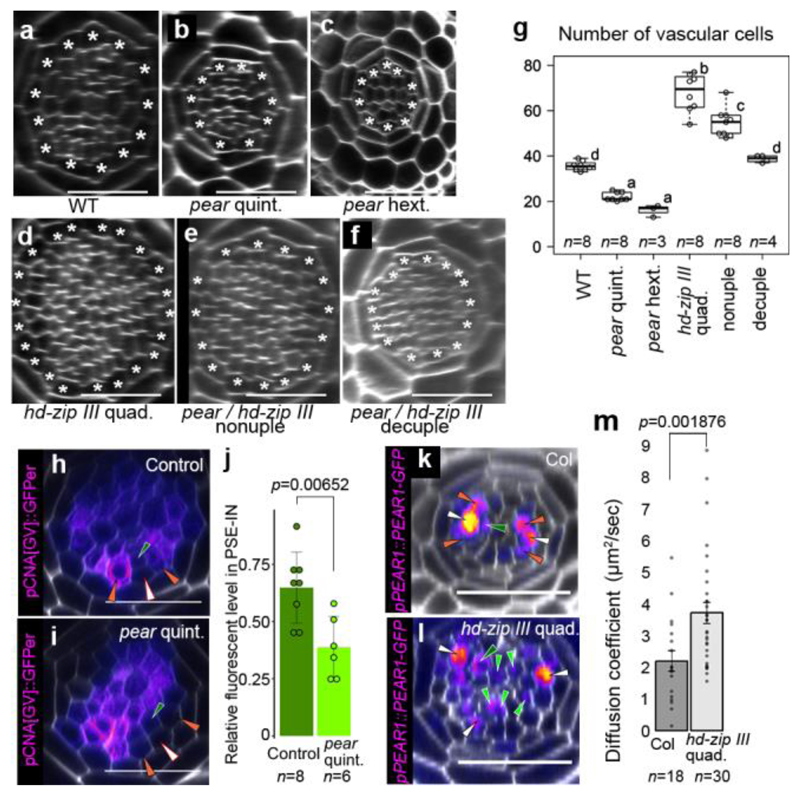
Figure 4. Antagonistic function of PEAR1 and HD-ZIP III sharpens the boundary between dividing and non-dividing cells.
a-f, An optical cross-section image of vascular tissue in wild type (a), pear quintuple (b), pear hextuple (c), hd-zip III quadruple (d), pear hd-zip III nonuple (e) and pear hd-zip III decuple mutant (f). Asterisks indicate pericycle cells. Each image is representative of independent biological samples analysed in g. g Quantification of vascular cell number. In the analysis of pear quintuple and pear hd-zip III nonuple, a population of slowly elongating roots is selected as described in Fig. 2f. h-i, Expression of CNA transcriptional reporter in the control (h, the heterozygous pear quintuple, n=4) and pear quintuple background (i, n=3). j,Fluorescent level in PSE-IN is significantly reduced in pear quintuple. n represents individual measurements across 4 or 3 independent biological samples, respectively. k-l, PEAR1-GFP localization in wild type (k, n=19) and hd-zip III quadruple mutant (l, n=17). PEAR1-GFP is broadly localized even in IPC in hd-zip III quadruple (l, light-green arrowheads). m, Average diffusion coefficient of PEAR1-GFP in wild-type and hd-zip III quadruple roots obtained by performing Raster Image Correlation Spectroscopy (RICS). In g-i and k-m, n represents independent biological samples. In g, boxplot centres show median. Statistically significant differences were tested using Tukey’s HSD test p<0.05. For individual P values, see Supplementary Table 3. In j and m, bar graphs represent mean. Error bars are s.d. (j) or s.e.m. (m). P values were calculated by two-sided Student’s t-test (j) or Mann–Whitney U test (m). Dots, individual data points. White, dark-green, orange, light-green arrowheads indicate PSE, PSE-IN, PSE-LN and IPC, respectively. Scale bars, 25 μm.

