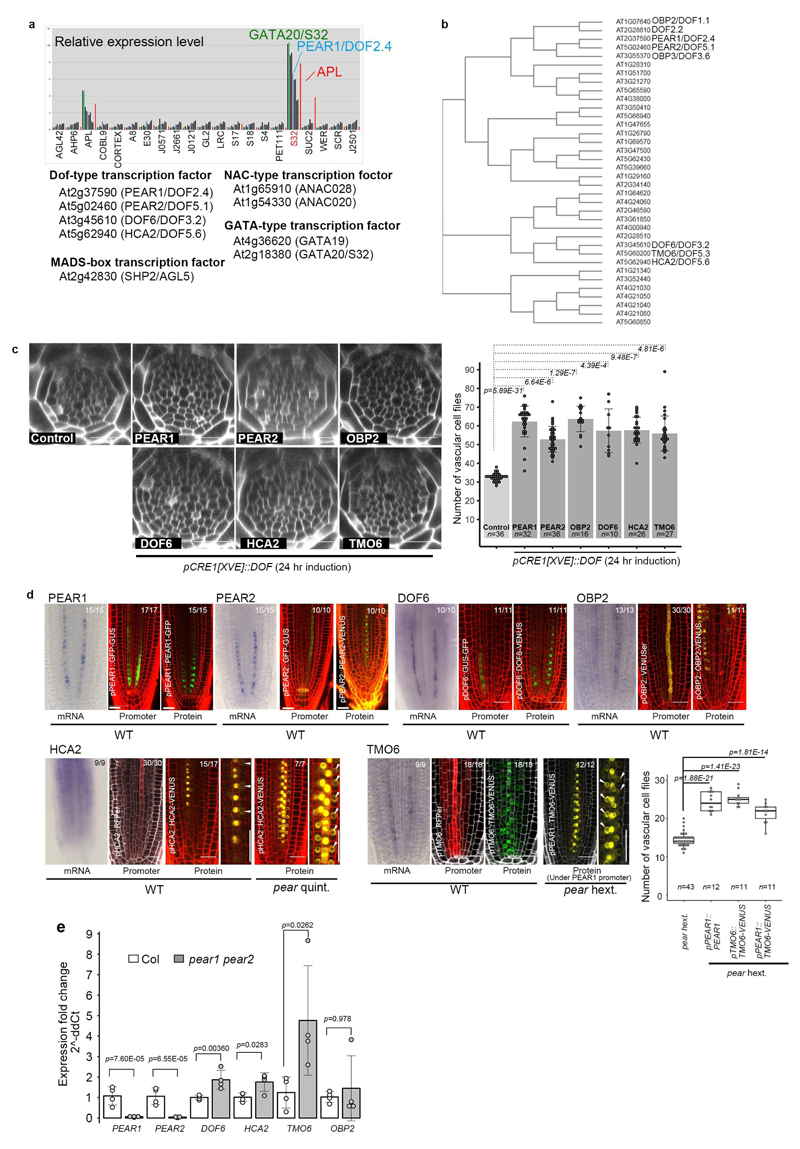
Extended Data Fig. 3. Identification of PEAR genes.
a, In silico analysis of the early phloem abundant transcription factors. Nine transcription factors are shown to be expressed abundantly in the early phloem cell (S32 fraction), containing four types of transcription factors, including DOF-type, MADS-box, NAC-type and GATA-type transcription factors. b, A phylogenetic tree of 36 Arabidopsis DOF transcription factors is drawn using Clustal Omega (https://www.ebi.ac.uk/Tools/msa/clustalo/). c, Overexpression of PEAR genes, including PEAR1, PEAR2, OBP2, DOF6, HCA2 and TMO6, under the CRE1 inducible promoter enhances periclinal cell division in the vascular tissue. n represents independent biological samples. Bar graphs represent mean. Error bars are s.d. Dots, individual data points. P values were calculated by two-sided Student’s t-test. d, Expression of six PEAR genes, including PEAR1, PEAR2, DOF6, TMO6, OBP2 and HCA2, show similar expression patterns to PEAR1, in which both mRNA and transcriptional fusion reporter exhibit PSE-specific pattern with a broad protein localization. HCA2 translational fusion in wild-type background exhibits weak but detectable signal in PSE-neighbouring cells (arrows), and its expression level is enhanced in the pear quintuple mutant background. Though TMO6 mRNA is highly specific to PSE cells, its transcriptional fusion reporter shows a broad but PSE abundant expression pattern with a broad TMO6 protein localization. Mobility of TMO6 protein is more evident when TMO6-VENUS is expressed under PSE-specific PEAR1 promoter (pPEAR1::TMO6-VENUS) in pear hextuple. Number in each panel indicates samples with similar results of the total independent biological samples analysed. Boxplot centres show median. P value calculated by two-sided Student’s t-test. Dots, individual data points. e, A quantitative analysis of PEAR transcripts in pear1 pear2 double mutant background. Note that the level of transcripts of three PEAR genes, including TMO6, DOF6 and HCA2, is elevated in pear1 pear2 background, suggesting that a compensation mechanism would mask the effect of pear1 pear2 loss of function (also see Supplemental Information). Bar graphs represent mean. Error bars are s.d. Dots, individual data points. P values were calculated by two-sided Student’s t-test. Scale bars, 25 μm.

