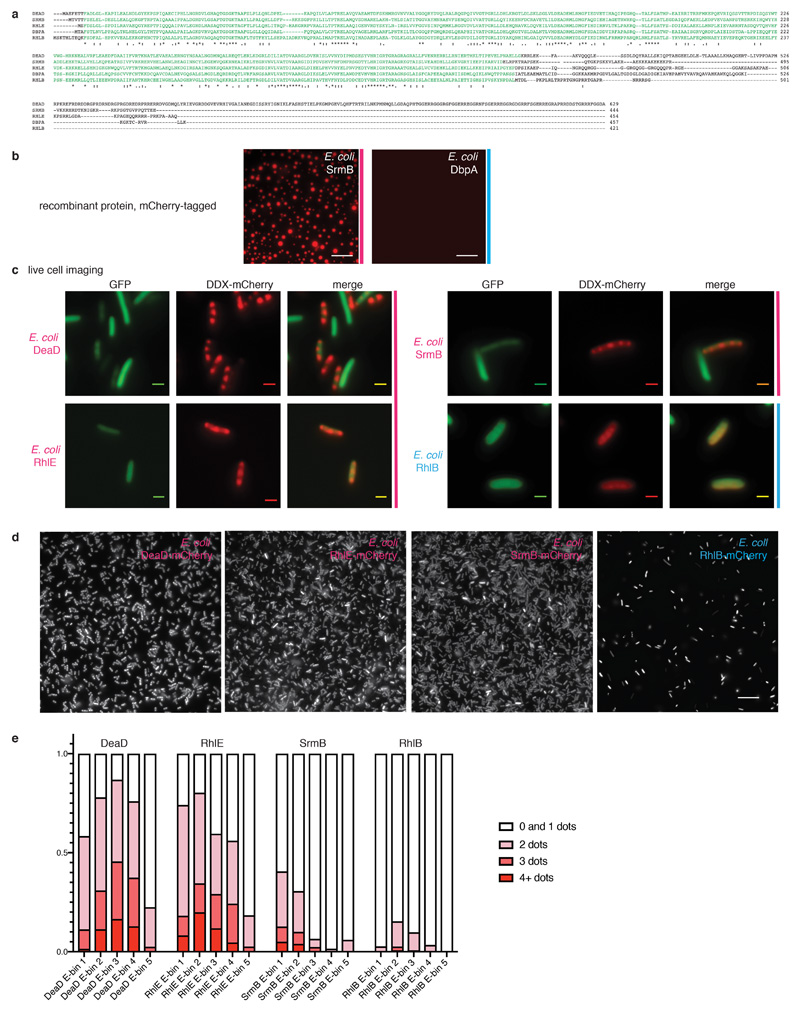
Extended Data Fig. 6. Three of the five E. coli DEAD-box ATPases harbor low complexity sequences, undergo phase separation in vitro and form foci in vivo.
(a) Clustal Omega alignment of the five E. coli DEAD-box ATPases. The RecA core is displayed in green; asterisks indicate sequence identity, dots represent sequence similarity. (b) In vitro phase separation of E.coli SrmB-mCherry (6 µM) and DbpA-mCherry (6 µM) in the presence of ATP and RNA; scale bar 25 μM. Representative images of 3 independent experiments. (c) Individual imaging channels of the composite images presented in Fig 2e; representative images of >3 independent experiments. DDX-mCherry, GFP and a composite image for E. coli DeaD, SrmB, RhlE, and for RhlB as a negative control. Scale bars 2 μM. (d) Larger field of view of E. coli DDX-mCherry expression samples. Scale bar 15 µm. Representative images of 3 independent experiments. (e) Quantification of foci in E. coli samples for 4 images per construct. Cells were segmented and for each individual cell, the mean fluorescence intensity and number of foci was quantified. Cells with 0 or 1 foci were grouped for technical reasons (see Material and Methods). Cells were binned based on mean fluorescence intensity, representing their expression level, and the three highest bins excluded from further analysis since they contain cells where fluorescence intensity has reached saturation. The percentage of cells containing 0 / 1, 2, 3 or more than 3 foci are plotted for each bin. There is no correlation between expression levels and focus formation in the various strains.

