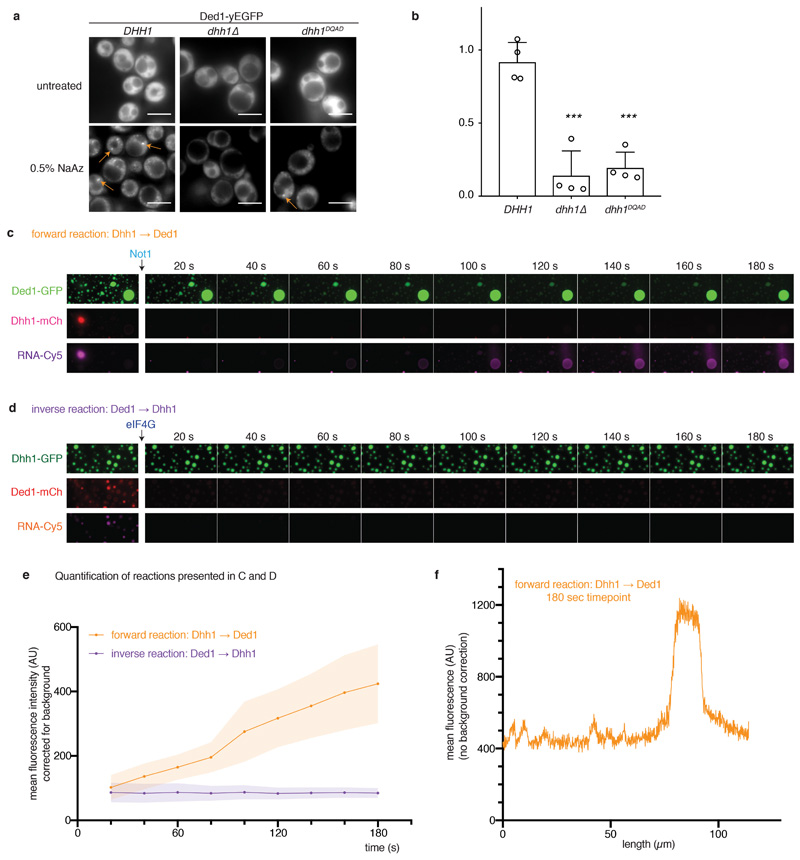
Extended Data Fig. 10. DDX ATPase activity regulates transfer of RNA molecules between phase-separated compartments in vivo and in vitro.
(A, B) In vivo, SG assembly upon treatment with 0.5% sodium azide was monitored by Ded1-yEGFP in cells expressing untagged Dhh1 WT or Dhh1DQAD as the sole copy, and in a dhh1Δ background. Quantification of SGs per cell was performed using Diatrack. 4 biological replicates, at least 855 (WT), 755 (dhh1Δ) or 106 (Dhh1DQAD) cells per replicate. Ded1 and Pab1 (polyA-binding protein) are bona fide markers of stress granules. Mean and SD, unpaired t-test (two-tailed), *** p = 0.0003 (dhh1Δ) respectively p = 0.0001 (Dhh1DQAD). Dots represent mean of individual replicates. (C, D) RNA transfer between Dhh1 and Ded1 droplets. (C) Forward reaction: Dhh1-mCherry droplets were assembled with Cy5-labeled RNA and added to Ded1-GFP droplets. Upon Not1MIF4G addition, Dhh1 droplets dissolve and the Cy5-RNA accumulates in the Ded1 droplets. (D) Inverse reaction: Ded1-mCherry droplets were assembled with Cy5-labeled RNA and added to Dhh1-GFP droplets. Upon eIF4GC-terminus addition, Ded1 droplets dissolve, but the Cy5-RNA does not accumulate in the Dhh1 droplets. In contrast to the reaction presented in the main Figure 4, for the reactions shown in C and D, no stabilizing agents such as BSA or PEG were added in order to make the results in the forward and inverse reaction comparable. The fluorescence intensity scaling was adjusted for the first image (before Not1 / eIF4G addition) to account for the sample dilution upon the addition of Not1 or eIF4G, respectively. However, scaling of the Cy5 channel in the first image, and in the subsequent frames [20s – 180s], is identical for the forward and the inverse reaction to enable a direct visual comparison. (E) Quantification of the reactions presented in (C) and (D). For each experiment, the mean Cy5-RNA intensity accumulating in six Dhh1-GFP droplets is plotted over time after addition of Not1 or eIF4G, respectively. For background correction, six identically sized areas outside of Dhh1-GFP droplets were quantified and subtracted from the intensity measured inside the Dhh1-GFP droplets, mean and SD. These experiments were repeated at least three times, with comparable results. Mean (line) and SD (shaded area) of 6 large droplets per movie and forward and inverse reaction. At t= 180 s, 16.7 +/- 2.7% of the Cy5-RNA is enriched in Ded1-GFP droplets occupying 5-7% of the surface area (n = 3 movies, mean and SD). (F) Line scan of the Cy5 channel (raw data), at timepoint t = 180 s through Ded1 droplets shown in Extended Data Fig. 6c. In the ‘forward’ reaction, Ded1 droplets enrich Cy5-RNA 2-3 fold over background.

