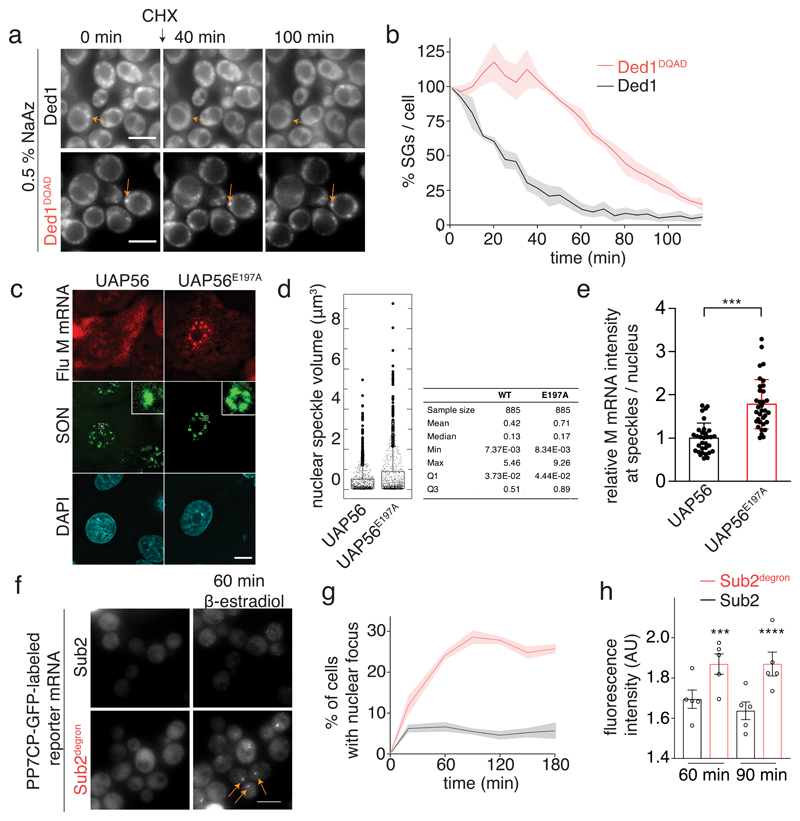
Fig. 3. The catalytic activity of DDXs regulates compartment turnover and RNA accumulation in phase-separated organelles.
(A) Ded1-mCherry labeled SGs were imaged after addition of 50 μg/ml cycloheximide (CHX). The ATP-deficient variants do not alter ATP and RNA-binding (Extended Data Fig. 3b,c) (B) Quantification of the percentage of SGs per cell normalized to t = 0 min; mean (solid line) and SEM (shaded area), n=3 biological replicates, at least 150 cells per replicate and strain. (C) A549 cells expressing WT or E179A mutant UAP56 were infected with influenza virus. After 6h, viral M mRNA was detected by smFISH and SON by immunofluorescene. Insets: enlargements of the marked white squares. Data are representative of three independent experiments. (D) Quantification of nuclear speckle volume (885 speckles per condition). (E) Quantification of relative M mRNA intensity at nuclear speckles (32 WT cells / 938 speckles and 34 E179A cells / 885 speckles). Mean and SD; two-sided t-test, *** p = 6.4*10-9. (F) Sub2 depletion leads to accumulation of a PP7CP-yEGFP labeled reporter mRNA in nuclear foci. Scale bar 5 μm. (G) Quantification of (F). Mean and SEM of 5 biological replicates with n>78 cells per time point. (H) Quantification of nuclear focus intensity, 5 (Sub2 degron) or 6 (WT) biological replicates; at least 13 / 33 cells (60 min WT / degron) or 14 / 60 (90 min WT / degron) cells per replicate. Mean and SEM; unpaired two-tailed t-test with *** p = 0.0002 and **** p = <0.0001. Dots represent the mean of individual replicates.

