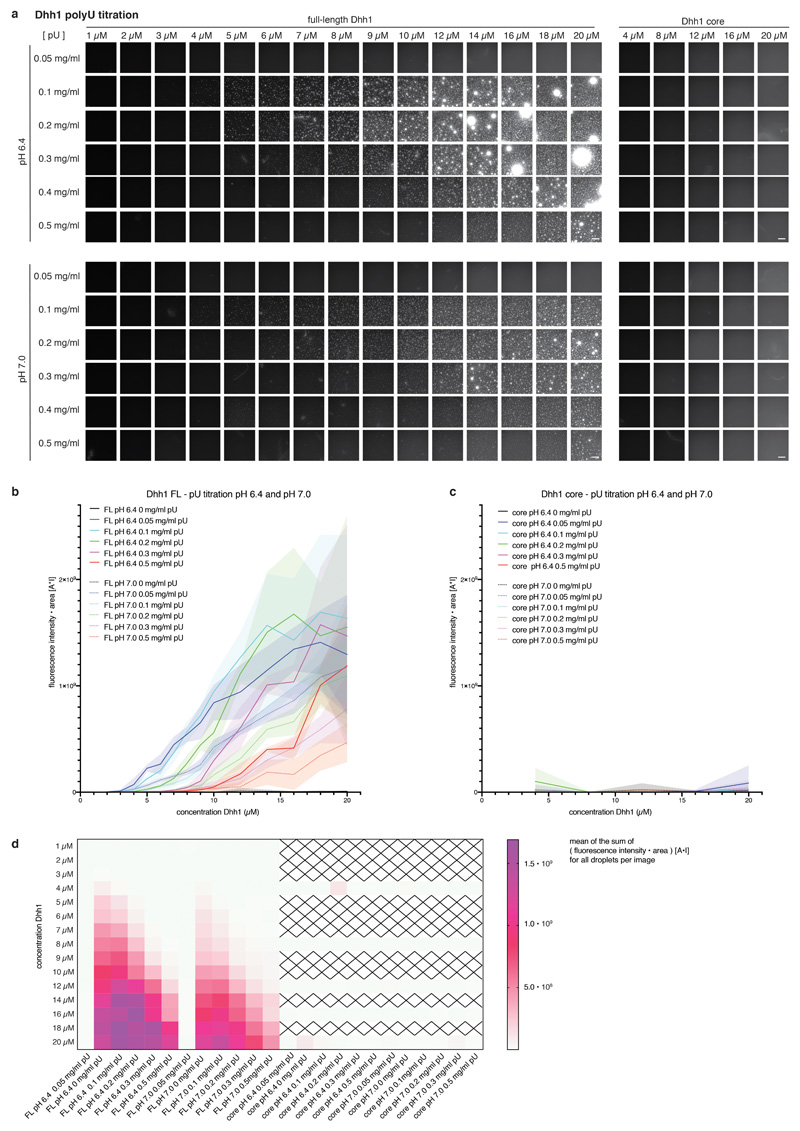
Extended Data Fig. 4. Phase separation behavior of full-length and tail-less (core) Dhh1 in different polyU concentrations.
Example images for the Dhh1 polyU phase diagram at pH 6.4 and 7.0. Reactions were assembled in 384 well plates. Each reaction contained 13.4 μl LSB-100, 2.1 μl 0.5 M KCl (final KCl concentration 100 mM), 1 μl CKM mix, 1.25 μl 100 mM ATP/MgCl2 (final concentration 5 mM), 1 μl 10 mg/ml BSA, 2 μl 1 M Hepes of the respective pH, 1.25 μl water / 10 mg/ml polyU to achieve the final concentration as indicated, and 3 μl MH200G containing Dhh1 to achieve the final concentration as indicated. Reactions were incubated at room temperature for 20 minutes and imaged at room temperature on a Nikon widefield microscope using an automated script (9 images per well of one replicate). Dhh1 core = Dhh1 (residues 48 - 425), lacking the low complexity tails. Scale bar 50 μm. (b-c) For each well, individual droplets in each image were quantified using Diatrack (see MM) for their area and mean intensity. The sum of the product [area * mean fluorescence intensity] (arbitrary unit: [A*I]) of all droplets in one image was plotted against the Dhh1 concentration (μM). (Dotted) lines represent the mean, shaded area the SD of the nine images recorded per well for one replicate. (b) FL = full-length Dhh1, (c) Dhh1 core = Dhh1 [48 - 425]. (d) Mean values of the [area * mean fluorescence intensity] (arbitrary unit: [A*I]) sum of the nine images recorded per well are plotted against the Dhh1 concentration for all conditions tested. Dhh1 core protein concentrations not tested are marked by a cross. FL = full-length Dhh1, Dhh1 core = Dhh1 [48 - 425].

