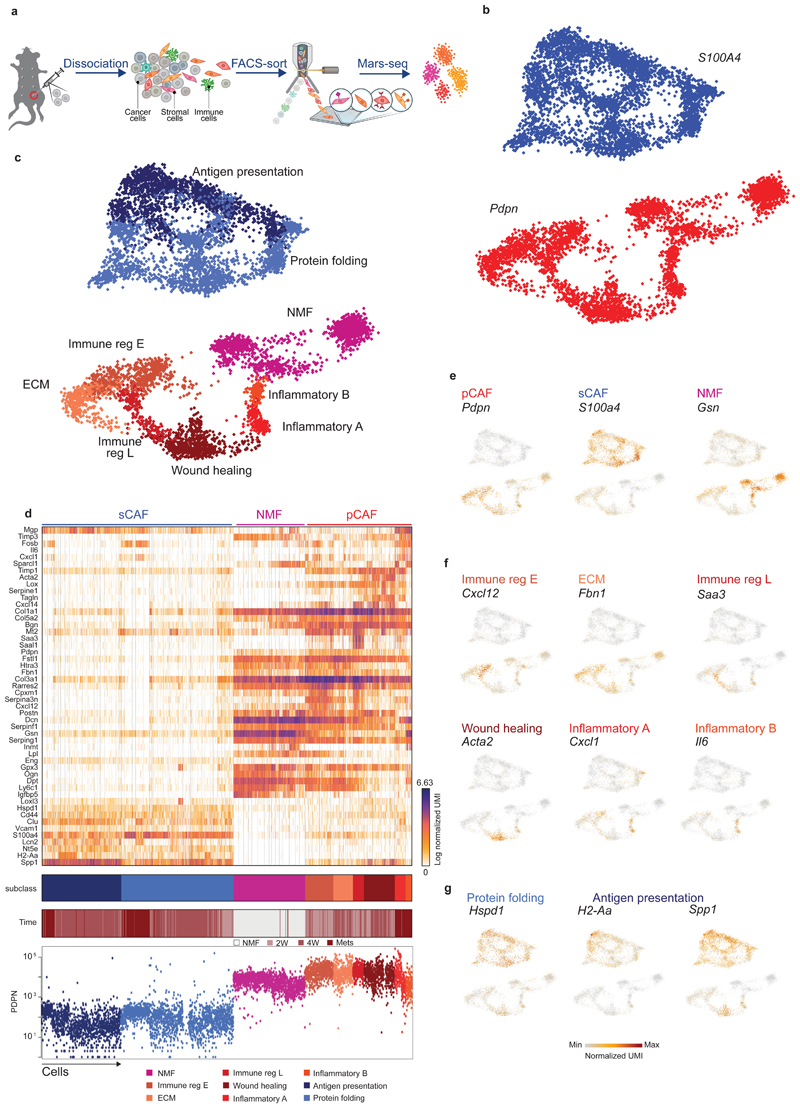
Fig. 1. Breast CAFs are comprised of distinct subsets with diverse transcriptional profiles.
a, Illustration of the experimental procedure. b and c, Single cell RNA-seq data from CAF and NMF was analyzed and clustered using the MetaCell algorithm, resulting in a two-dimensional projection of 8033 cells from 15 mice. 83 meta-cells were associated with 2 broad fibroblast populations (b) and 9 functional subclasses (c) annotated and marked by color code. (d) Gene expression of key markers genes across single cells from all subclasses of NMF, pCAF, and sCAF. Lower panels indicate the association to subclass, the time-point, and the PDPN index sorting data, showing protein level intensity in each cell. e-g, Expression of key markers genes for NMF, pCAF, and sCAF (e); functional annotation for pCAF subclasses (f) and sCAF subclasses (g) on top of the two-dimensional projection of breast CAFs. Colors indicate log transformed UMI counts normalized to total counts per cell.

