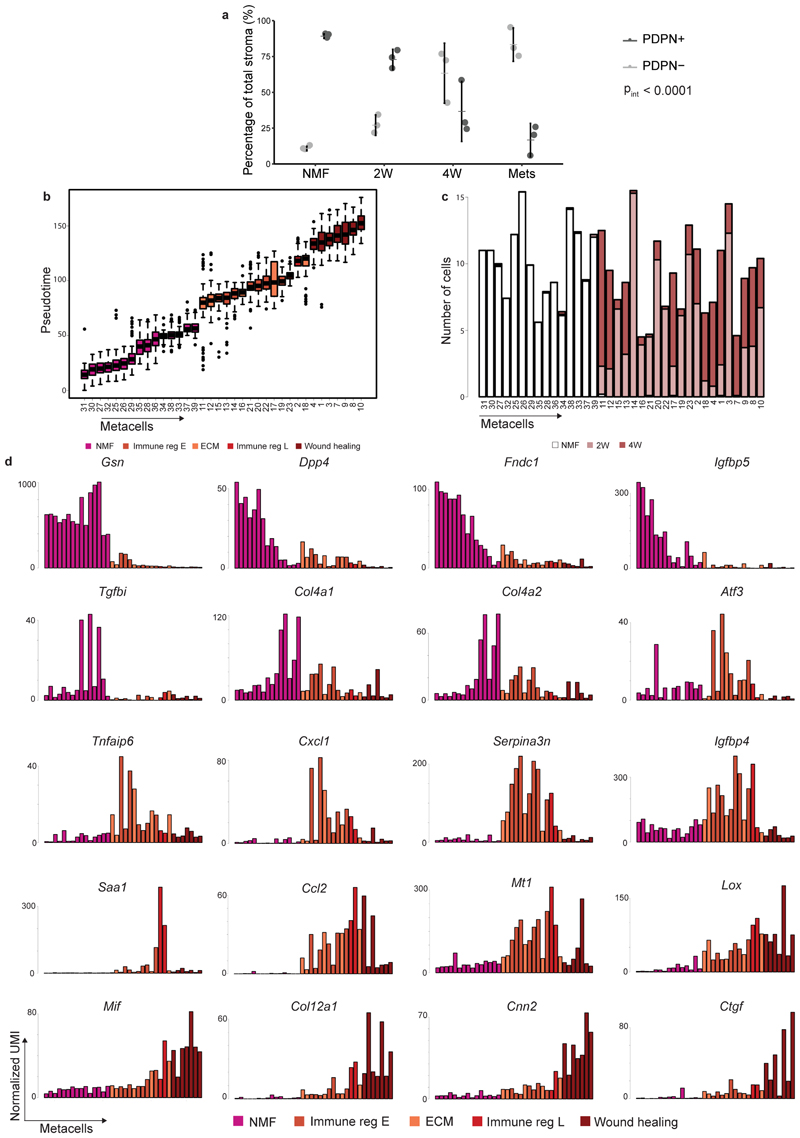
Extended Data Fig. 2. Pdpn+ fibroblasts undergo dynamic changes in gene expression and subset composition during tumor progression.
a, Cell-surface PDPN protein expression levels obtained from the sorting data were used to quantify the percent of PDPN+ and PDPN- cells in the CD45- EpCAM- stroma in the different time points.Data are combined from 7 independent experiments; n=3 mice per group. Error bars represent 95% CI of the mean. P-value of the two-way ANOVA interaction between fibroblast subtype and time point is presented.b, Pseudo-time of expression for individual metacells (color coded by functional subclasses as in Fig. 2) included in the slingshot analysis. A total of n=3465 cells was analyzed. Box plots display median bar, first–third quartile box and 5th–95th percentile whiskers. c, Distribution of cells across time points (color coded) within metacells included in the slingshot analysis. Metacell numbers and order are consistent across all figure panels and match the order in Fig. 2. d, Expression of hallmark NMF and pCAF genes (additional to those presented in Fig. 2e) across metacells (average UMI/cell), ordered by pseudo-time.

