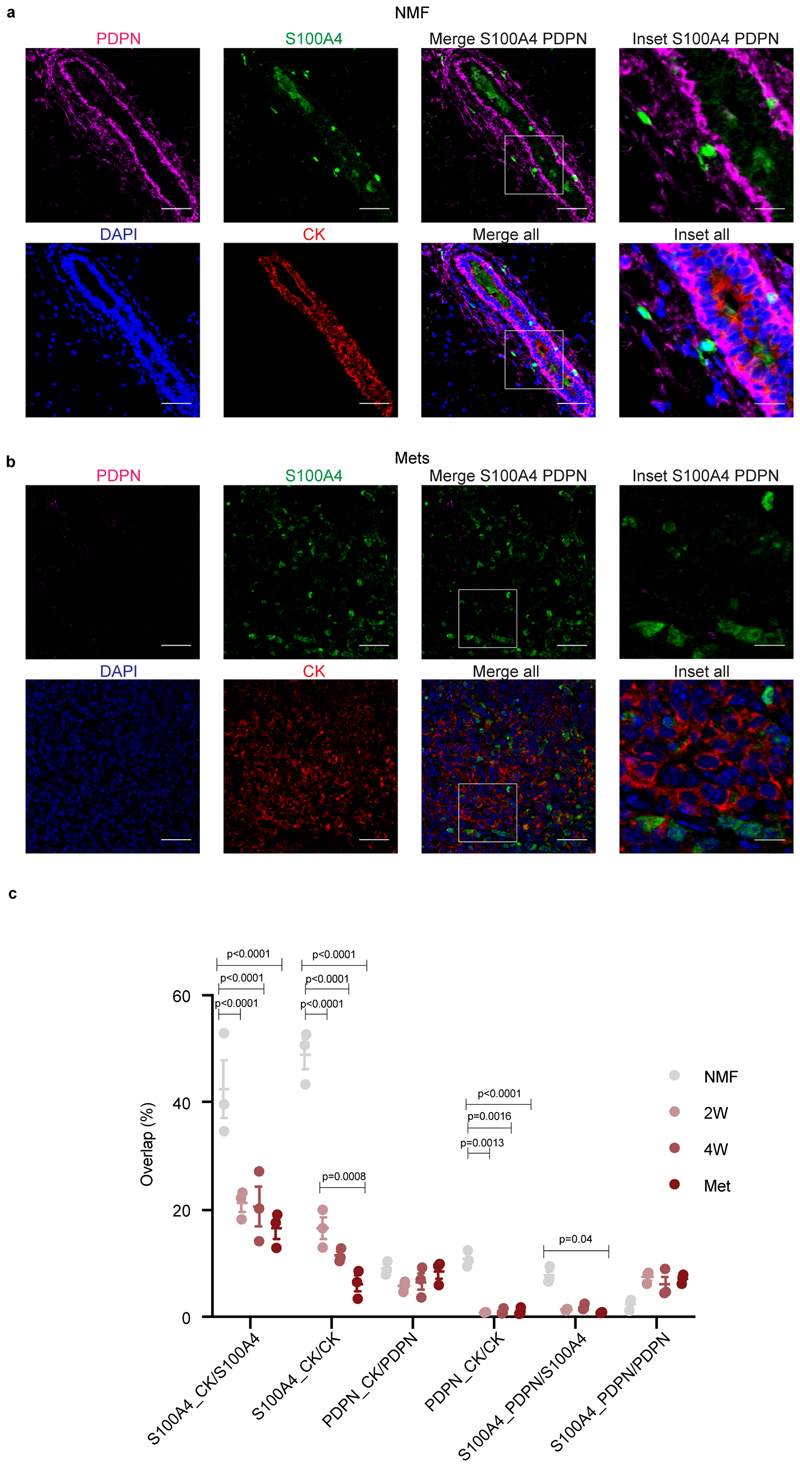
Extended Data Fig. 4. PDPN and S100A4 proteins mark distinct types of cells in 4T1 mouse tumors, the majority of which are CK-negative.
a-b, Representative images of normal mammary fat pads (NMF; a) and lung metastases (Mets; b) (see Fig. 4a) stained with antibodies against the indicated proteins. n=3 mice per time point; Scale bar = 50 m, inset scale bar = 17μm. c, Quantification of the average overlap between CK, PDPN, and S100A4 staining in NMFs, primary tumors (2W and 4W) and Mets. Points represent the number of overlapping pixels between two channels, divided by the total number of pixels of the originating channels, in n=3 biological replicates (each dot is an average of 9 images per mouse). Mean ± SEM, p-values were calculated by two-way ANOVA followed by Tukey’s multiple comparisons test.

