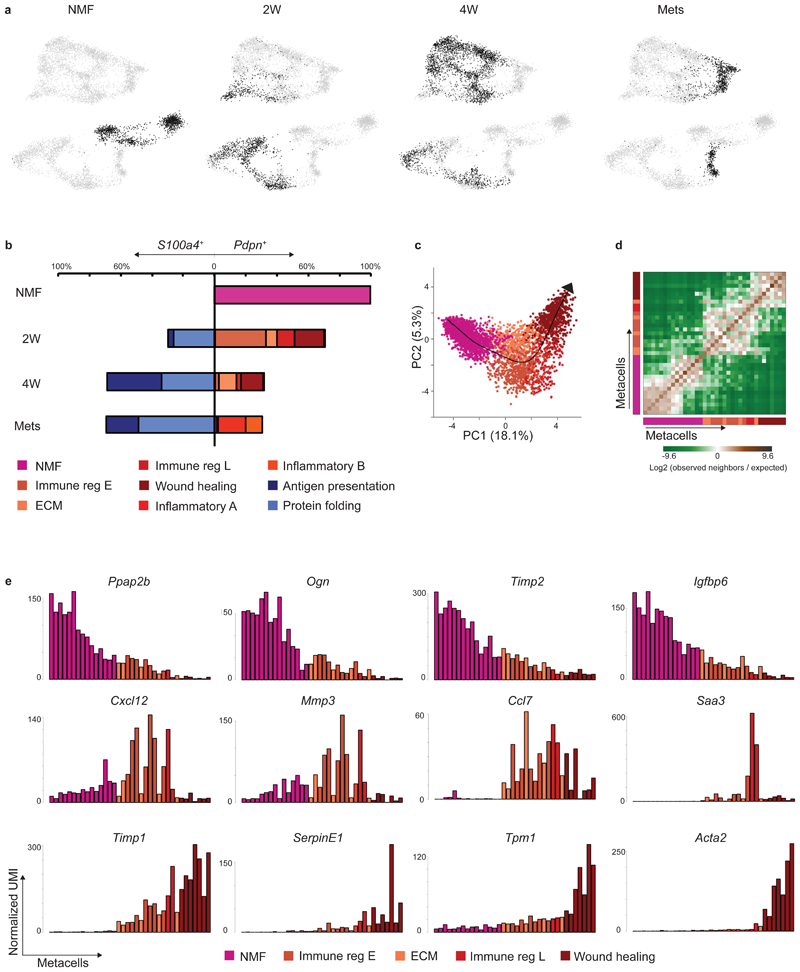
Fig. 2. CAF composition and gene expression changes with tumor growth and metastasis.
a, Projection of 8033 cells from different time points (black) on top of the 2D map of breast fibroblasts (presented in Fig. 1b-c). b, Compositions of Pdpn+ fibroblasts (right) and S100a4+ fibroblasts (left) at different time points (normalized to 100% total fibroblasts). Subclasses are annotated and color-coded. c-e, Slingshot analysis of pseudo-time trajectory from NMF to pCAF from 2W and 4W. A total of 3465 cells was analyzed. Cells are color-coded as in b. c, Suggested trajectory from NMF to pCAF projected over the top two principal components. d, Heat map showing enrichment (log2 fold change) for kNN connections between metacells over their expected distribution. Metacells are ordered by their position on the Slingshot pseudotime. e, Expression of hallmark NMF and pCAF genes across metacells (average UMI/cell), ordered by pseudo-time.

