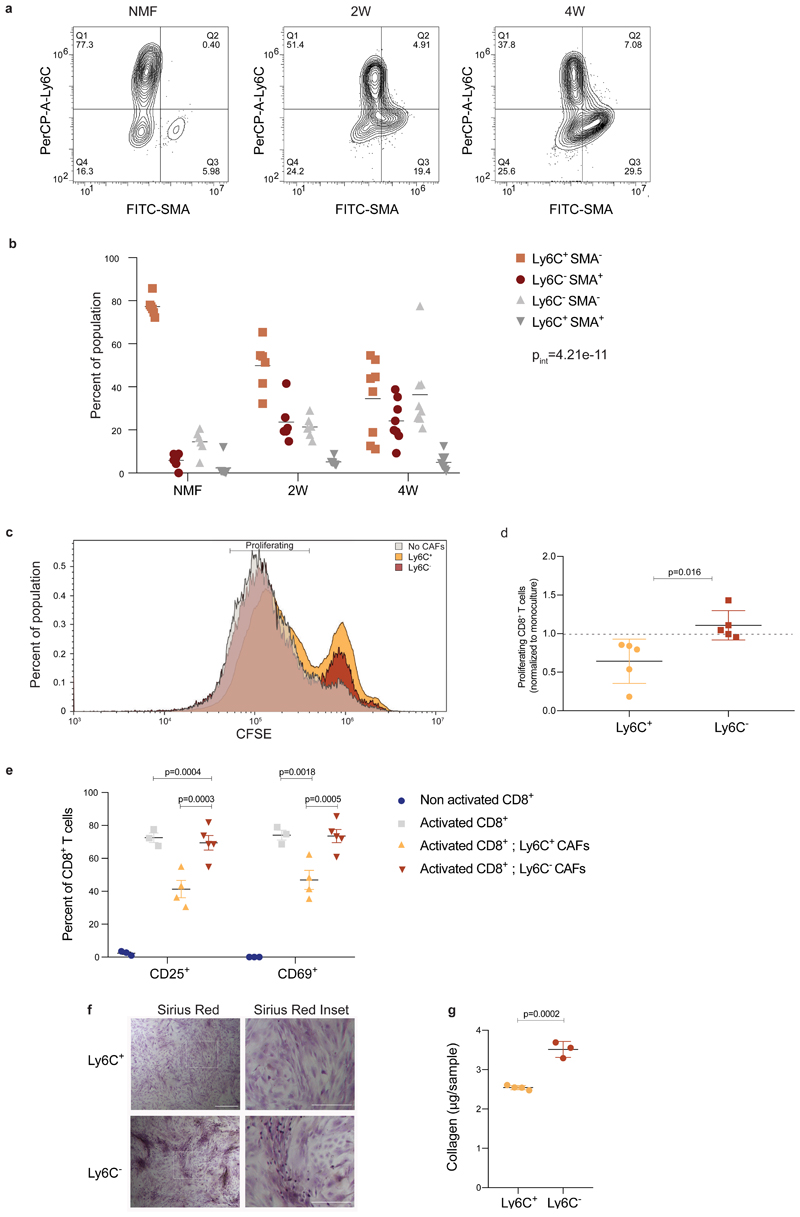
Fig. 5. Ly6C+ pCAFs suppress CD8 T-cell proliferation, in vitro.
a-b, FACS analysis of Ly6C and SMA expression in CD45- EpCAM- PDPN+ cells freshly harvested from normal mammary fat pads, 2W tumors, and 4W tumors, and immediately fixed. Representative flow cytometry plots from one mouse are shown in (a) and the results are quantified in (b). n=6 mice for NMF and 2W; n=8 mice for 4W, data are combined from 3 independent experiments and are presented as mean, analyzed using two-way ANOVA followed by Tuckey's multiple comparisons test. Pint – P interation between time and population. c-d, CD45- EpCAM- PDPN+ cells from 4W tumors were sorted to Ly6C+ vs Ly6C- populations, which were then incubated in vitro at 1:1 ratio with CD8+ T cells activated by CD3/CD28 beads and marked by CFSE for 48h. Representative FACS plots of CFSE signals from one experiment are shown in (c) and the results from n=5 independent experiments, each with different mice, normalized to the average proliferation with no CAFs per experiment are presented in (d) as mean ± SD, analyzed utilizing two-sided Students’ T-test. e, Flow cytometry analysis of CD25 and CD69 activation markers in CD8+ T cells activated and co-cultured with pCAFs as described in (c), or incubated in monoculture with and without activation. The experiment was repeated 3 times, each with different mice. Results from one representative experiment are shown in (e). For non-activated CD8+ and activated CD8+ n=3; for activated CD8+ with Ly6C+ CAFs n=4; for activated CD8+ with Ly6C- CAFs n=5 independent culture wells;mean±SEM; two-way ANOVA followed by Tuckey’s multiple comparisons test. f-g, CD45- EpCAM- PDPN+ cells from 4W 4T1 tumors were sorted to Ly6C+ vs Ly6C- populations, which were then grown to confluence in vitro, passaged once, allowed to secrete collagen for 4 days and stained with Sirius Red (see Methods section). The experiment was repeated 4 times, each with different mice. Results from one representative experiment are shown in (f). Quantification of Sirius Red staining in a representative experiment is shown in (g). n=4 Ly6C+; n=3 Ly6C- independent culture wells. Mean±SEM, two tailed Student’s T-test. Scale bar = 500 μm, inset scale bar = 250 μm.

