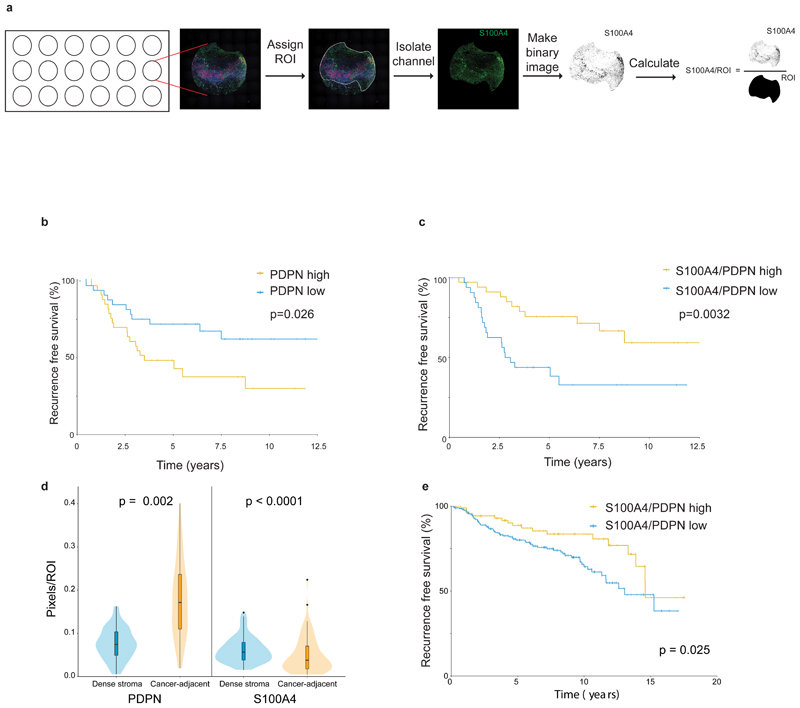
Fig. 7. PDPN and S100A4 stromal staining is correlated with disease outcome in human breast cancer patients.
a, Illustration of pixel-based image analysis workflow. b-c, FFPE tumor microarray (TMA) sections from a cohort of TNBC patients (n=70) were immunostained for PDPN, S100A4 and CK and scored (see Methods section). PDPN scores (b) or S100A4/PDPN scores (c) were classified as higher or lower than the median, and the association with recurrence-free survival of n=70 patients was assessed by Kaplan Meier (KM) analysis. P-value was calculated using log rank test (two sided).d, Cancer-adjacent regions and regions of dense stroma were determined for each core in the TNBC TMA based on CK staining (see Methods section), and PDPN and S100A4 staining in each region was scored.n=70 patients, median is presented with 1st and 3rd quartiles with trimmed violin plot overlay, P-value was calculated using Wilcoxon matched pairs signed rank test, two sided.e, FFPE TMA sections of breast cancer patients from the METABRIC cohort (n=288 patients) were stained and scored for PDPN, S100A4 and CK as described in (b-c). S100A4/PDPN scores were classified as higher (n=88) or lower (n=200) than 1 (5 outlier samples were omitted from the analysis; see Methods section), and the association with recurrence-free survival was assessed by Kaplan Meier (KM) analysis. P-value was calculated using log rank test (two sided).

