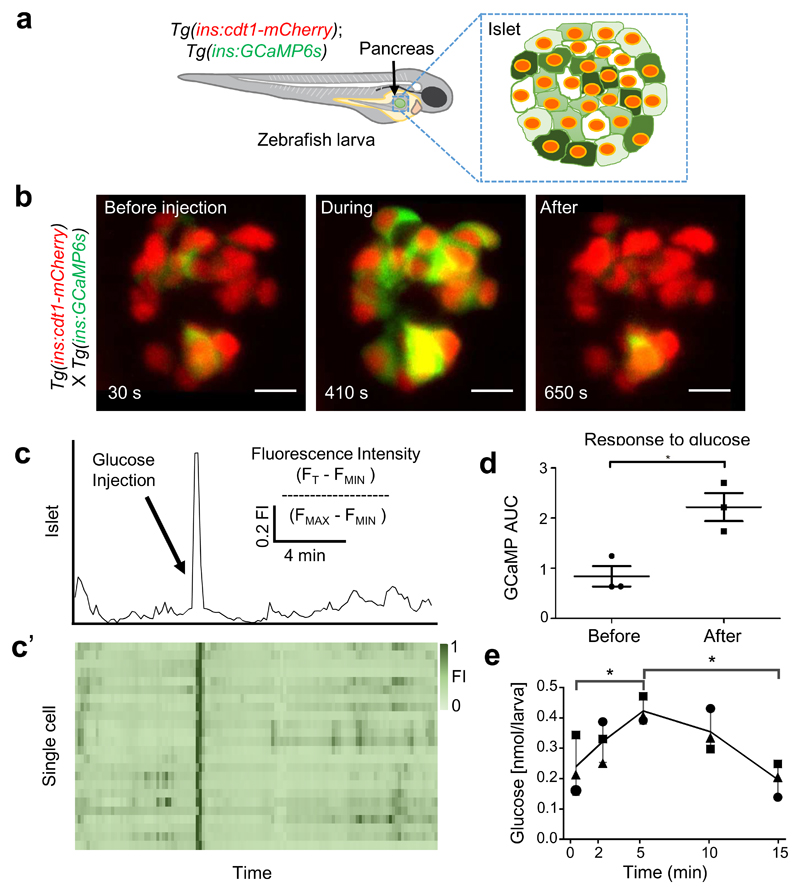
Figure 1. Glucose-stimulated Ca2+ influx imaged in vivo in the living zebrafish.
a. Cartoon representing a transgenic zebrafish larva expressing the genetically-encoded Ca2+ indicator GCaMP6s (green) and the nuclear marker cdt1-mCherry (red) under the insulin promoter. GCaMP6s allows the examination of glucose-induced Ca2+-influx in the β cell reported by changes in the green fluorescence in a Ca2+ concentration-dependent fashion. b. Maximum intensity projections of an islet imaged before, during and after the intra-cardiac injection of 5 nL of 25 mM glucose solution. Imaging and glucose stimulation were performed simultaneously. Note the near-synchronous increase in GCaMP6 fluorescence intensity across all the β cells in the islet upon glucose injection. c. A trace showing cumulative normalized fluorescent intensity over time for the cells shown in A. The black arrow marks the instance of the glucose injection. c’. Normalized fluorescence intensity over time for each individual cell. Each cell is represented by a square. The normalized GCaMP6 fluorescence is displayed as a heat-map, showing the degree of cell activity (n=10 animals, not graphically represented here). d. Quantification of the islet response to glucose stimulation. The graph depicts the GCaMP6 area under the curve covering 100 seconds before and 100 seconds after the glucose stimulation (n=3, paired two tail t-test, P=0.0108, data are means ± SD). The injection of glucose led to a dramatic increase in GCaMP6 fluorescence intensity. e. Changes in measured free glucose concentration in larvae following glucose injection as in A. Each dot represents a pool of 10 injected larvae. (n=3 for each time point, one-tailed ANOVA, with Tukey's multiple comparisons test, P= 0.0488 for 0 vs. 5min and P= 0.0152 for 5 vs.15min). Data are means ± SD. Scale bars, 10 μm. The cartoons shown in panel (a) belong to the authors of this study. The experiments in b,c were performed three independent times with several samples showing similar results. d shows a quantification from thee biological replicates from one of the repeats. The experiment in e was performed once with multiple samples.

