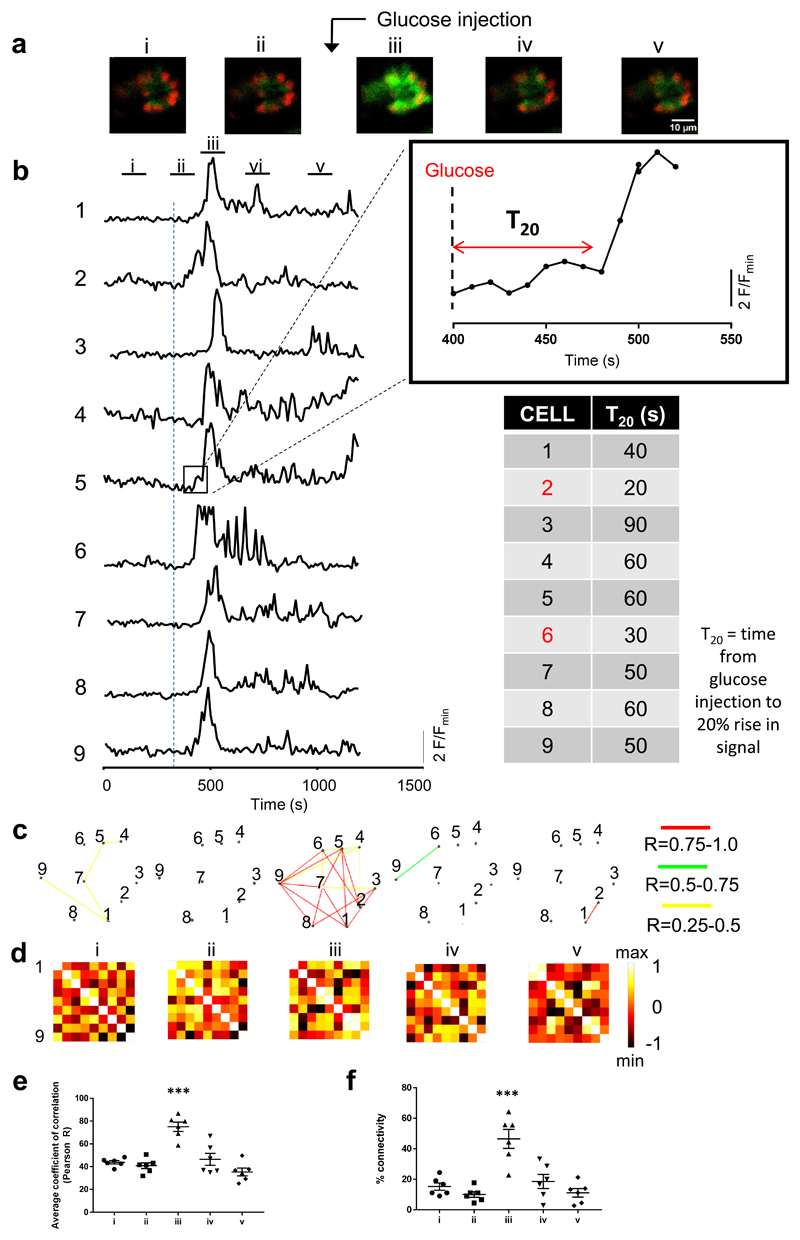
Figure 2. Ca2+ dynamics and connectivity in zebrafish: slow imaging acquisition (frame rate 0.1Hz).
a. Single confocal planes acquired during each time window (labelled i-v) show an increase in GCaMP fluorescence intensity during time window iii (i.e. coinciding with intracardiac glucose injection) but no strong GCaMP signal before glucose injection (time windows i-ii) or after glucose injection (time windows iv-v). Time windows i-v were 100 s long. b. Representation of a normalised fluorescence trace generated by each β-cell region of interest (ROI) across the entire imaging session (1,200 s). Time windows (100s) labelled i-v are shown at the top and the dashed line represents the time of intra-cardiac glucose injection. T20 was defined as the time taken between glucose injection and the calcium intensity spike to reach 20% above baseline. This value is tabulated for each ROI, thereby identifying cell 2 and cell 6 as “leaders”. c. Cartesian functional connectivity maps displaying the x-y position of analysed cells (numbered black dots). Cells are connected with a coloured line if the p statistic for the Pearson coefficient was < 0.001 post bootstrapping. The strength of the cell pair correlation (the Pearson R statistic) was colour coded: red for R of 0.75 to 1.0, yellow for R of 0.5 to 0.75 and green for R of 0.25-0.5. Results confirm an increase in cell-cell connectivity (strength AND number) during glucose injection (time window iii). d. Heat maps show the Pearson coefficient of each cell pair in a colour-coded manner (negative correlation; dark brown (-1), no correlation; mid brown (0), high correlation; yellow/white (1)). e. During time window iii (ie at time of glucose injection) the mean positive Pearson coefficient for connected cell pairs is 0.75 +/- 4.08 (SEM), significantly higher than before or after glucose injection (window i R 43.8 +/-1.46, ii R 0.48 +/- 2.59, iv R 46.4 +/- 5.3 and v R 0.35 +/- 3.45) (P<0.001 on one way ANOVA with Tukey’s multiple comparison). f. The overall percentage of connected cell pairs is elevated (46% +/- 6.18% SEM) during the glucose injection compared to the rest time points (window i 15.3% +/- 2.4, window ii 10% +/- 1.86, iv 18.6% +/- 4.6 and window v 11.1% +/1 2.7). (n=6, P<0.001 one way ANOVA with Tukey’s).

