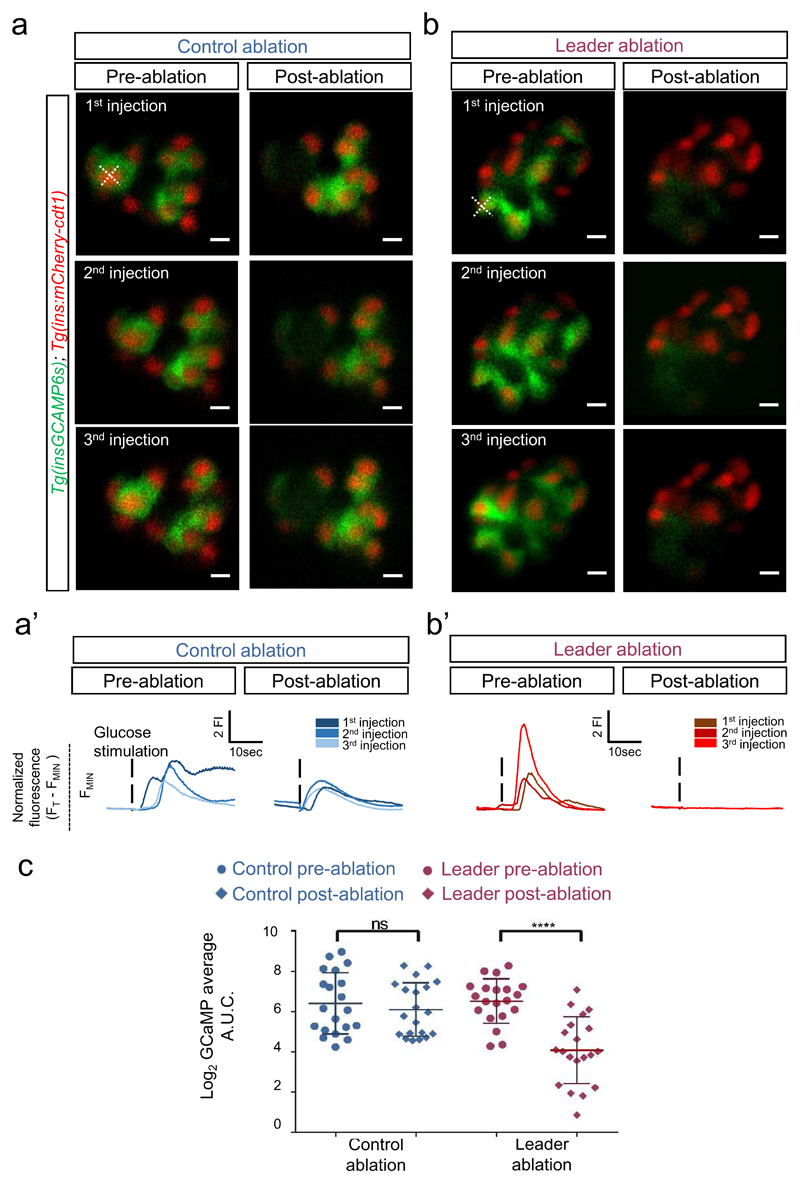
Figure 4. Ablation of temporally-defined “leader” cells (but not follower cells) alters islet responsivity to glucose in vivo in the zebrafish.
a-b. Images from the time-lapse recording (six frames/second, single plane) of the islet following three consecutive glucose stimulations before and after “leader” or “follower” (control) cell ablation. Glucose was injected at 5 min. intervals whilst Ca2+ dynamics were monitored. After the identification of presumptive “follower” or “leader” cells, these cells were ablated using a two-photon laser ablation (see Methods). An X. indicates the targeted cells. The top panels show representative frames from the movies before and after the ablation of a “follower” (a) or a “leader” cell (b). The lower traces (a’-b’) show the normalized GCaMP6 fluorescence traces and the peak in Ca2+ influx following glucose injection pre- and post-ablation. c. Quantification of the Area Under the Curve (A.U.C.) reflecting 200 frames of normalized GCaMP6 fluorescence before and after the ablation of a “follower” or a “leader” cell (n = 20 islets each) (paired two-tailed t-test, P= 3.43 x 10⁻⁵, ns: not significant). The ablation of “leader”, but not “follower” cells, led to a significant reduction in the total islet GCaMP response. Each data-point represents the mean A.U.C from three glucose-injections in individual larvae. Data are means ± SD. The experiments were performed eight independent times with several samples showing similar results.

