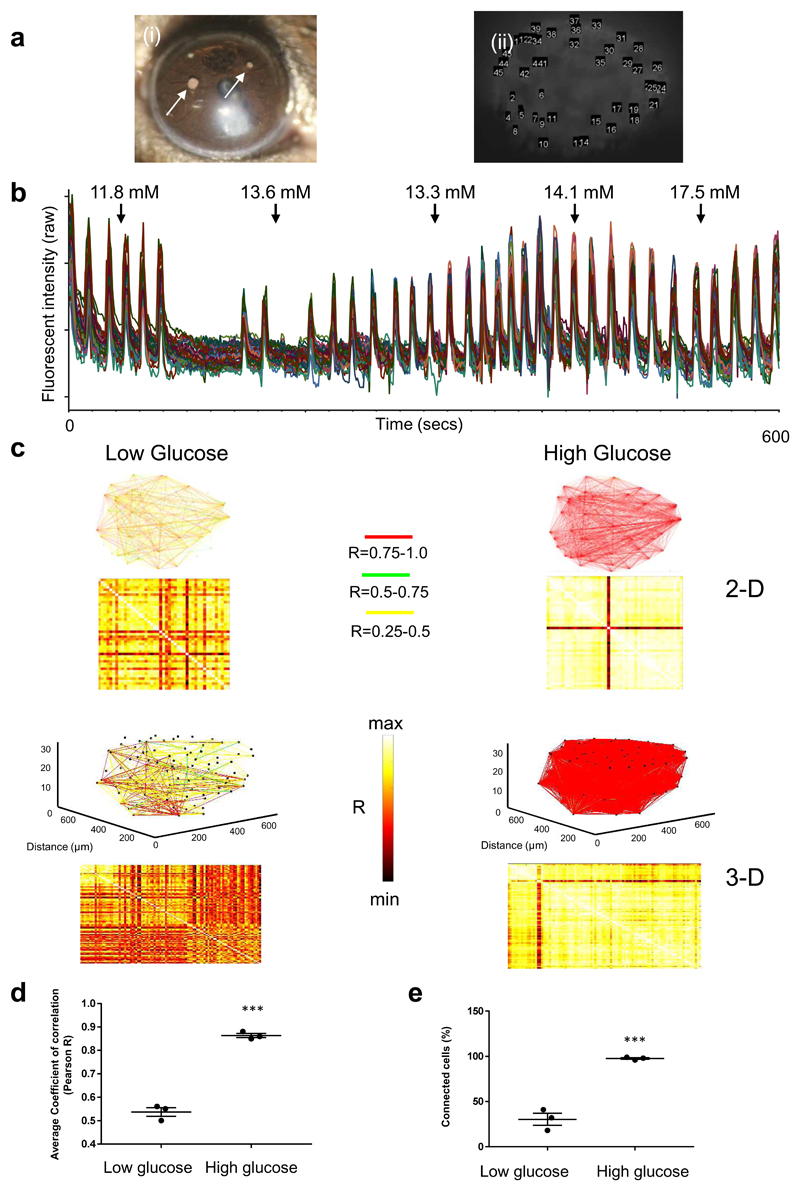
Figure 5. Ca2+ waves and connectivity revealed using islets expressing GCaMP6f throughout the cell population under insulin promoter control.
a. (i) Image of a donor islet that implanted onto the iris of a syngeneic recipient. Islets indicated with arrows. (ii) Individual cells identified within a single islet were analysed. b. Imaging for 10 minutes at 1fps of an islet that was exposed to chronically elevated circulating glucose levels (measured values indicated at the time points they were measured along the top). Ca2+ traces from 50 individual β cell ROIs are superimposed, demonstrating retained coordination of wave behaviour over time c. Pearson heat maps and Cartesian connectivity maps in two dimensions (2D – upper four panels) and 3D (lower four panels). The sharp increase in β cell connectivity occurs in 3D across the entire islet and mirrors what is captured in 2D (single plane). d and e. Pooled data for the three animals imaged in 3D. Note that the rise in mean Pearson coefficient of β cell connectivity and proportion (%) of cells connected in the low versus high glucose state in 3D was comparable to that measured in 2D. 2D image dataset (n=5 islets in 5 different animals, not graphically represented here) revealed a mean rise in Pearson R from 46.4 +/- 7.2 to 92.6 +/- 0.9 (P<0.01 on two-tailed t-test) and rise in % connectivity from 19.7 +/- 5.5% to 88.8 +/- 5.9% (P < 0.001 on two-tailed t-test).

