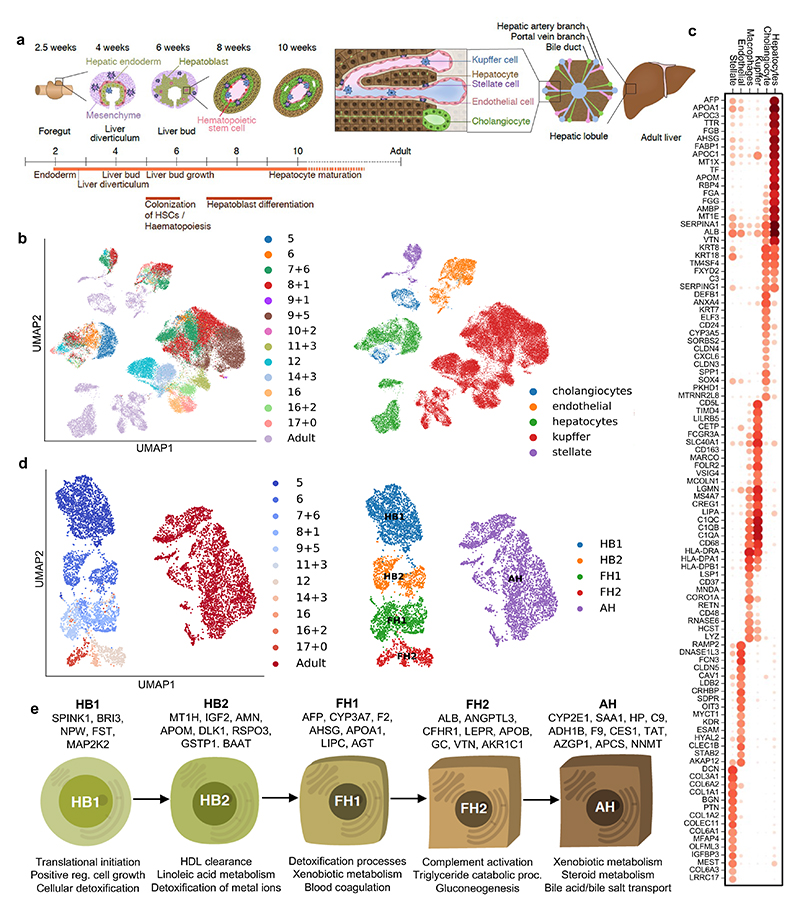
Fig. 1. Single-cell transcriptomic map of human liver development.
a, Schematic representation of human liver development. b, UMAP visualization of all integrated single-cell transcriptomic data of fetal and adult human hepatic cells generated using the 10x Genomics workflow; annotation indicates post-conceptional weeks (PCW) + days (left panel) and the cell-specific lineages (right panel). c, Gene expression values of selected differentially expressed genes (DEGs) for each hepatic cell lineages. Gene-expression frequency (fraction of cells within each cell type expressing the gene) is indicated by dot size and level of expression by colour intensity; colour intensity shows “gene expression [mean-scaled, log-normalized counts]”. d, UMAP visualization of hepatocyte developmental trajectory (left panel) and annotation of developmental stages based on Louvain analysis (right panel): HB1, hepatoblast stage 1; HB2, hepatoblast stage 2; FH1, fetal hepatocyte stage 1; FH2, fetal hepatocyte stage 2; AH, adult hepatocyte. e, Characteristic genes induced at each stage of hepatocyte differentiation and corresponding gene ontology (GO). Plots integrate scRNA-seq data from n=17 independent fetal livers aged 5-17 PCW and n=16 independent adult livers.

