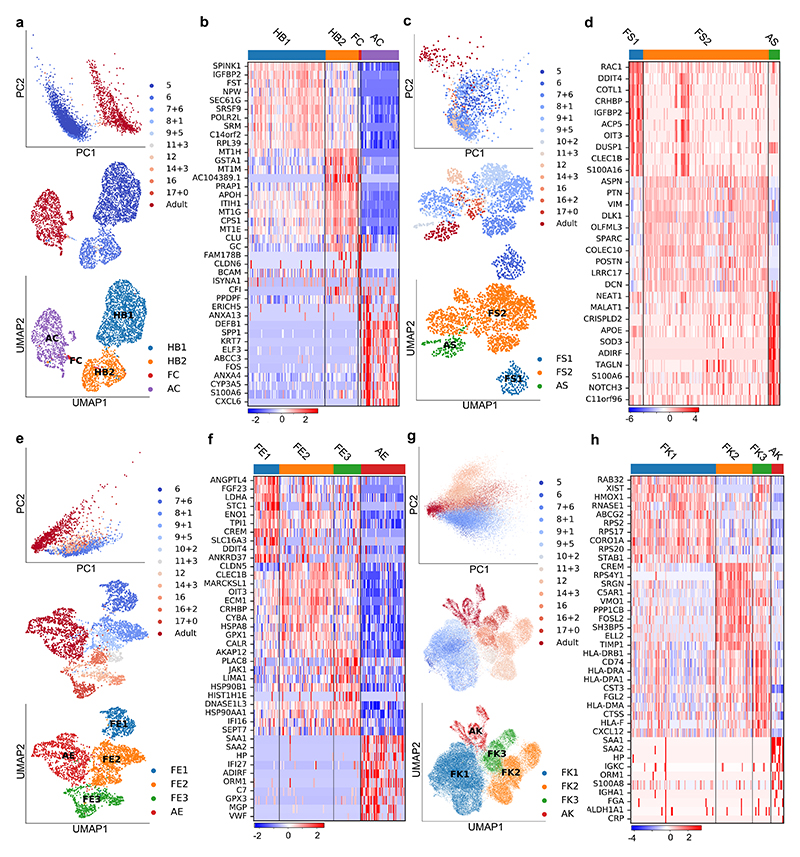
Fig. 2. Mapping nonparenchymal cell identity during human liver development.
a, PCA (top) and UMAP (middle) plots of primary human cholangiocyte sample timepoints and UMAP annotation of discrete cholangiocyte developmental stages (bottom); HB1 = hepatoblast 1, HB2 = hepatoblast 2, FC = fetal cholangiocyte, AC = adult cholangiocyte. b, Heatmap showing time-related DEGs of each stage of primary cholangiocyte development. c, PCA (top) and UMAP (middle) plots of primary human hepatic stellate cell sample timepoints and UMAP annotation of discrete stellate cell developmental stages (bottom); FS1 = fetal stellate cell 1, FS2 = fetal stellate cell 2, AS = adult stellate cell. These three developmental stages correlate with the onset of haematopoietic function of the liver and birth. d, Heatmap showing time-related DEGs of each stage of primary hepatic stellate cell development. e, PCA (top) and UMAP (middle) plots of primary human endothelial cell sample timepoints and UMAP annotation of discrete endothelial cell developmental stages (bottom); FE1 = fetal endothelial cell 1, FE2 = fetal endothelial cell 2, FE3 = fetal endothelial cell 3, AE = adult endothelial cell. f, Heatmap showing time-related DEGs of each stage of primary endothelial cell development. Endothelial cells are closely associated with haematopoietic stem cell differentiation, with changes of function associated with haematopoietic and vascularization events. g, PCA (top) and UMAP (middle) plots of primary human Kupffer cell sample timepoints and UMAP annotation of discrete Kupffer cell developmental stages (bottom); FK1 = fetal Kupffer cell 1, FK2 = fetal Kupffer cell 2, FK3 = fetal Kupffer cell 3, AK = adult Kupffer cell. h, Heatmap showing time-related DEGs specific to each stage of primary Kupffer cell development. Heatmap colour scales show “gene expression [mean-scaled, log-normalized counts]”. Plots integrate scRNA-seq data from n=17 independent fetal livers aged 5-17 PCW and n=16 independent adult livers.

