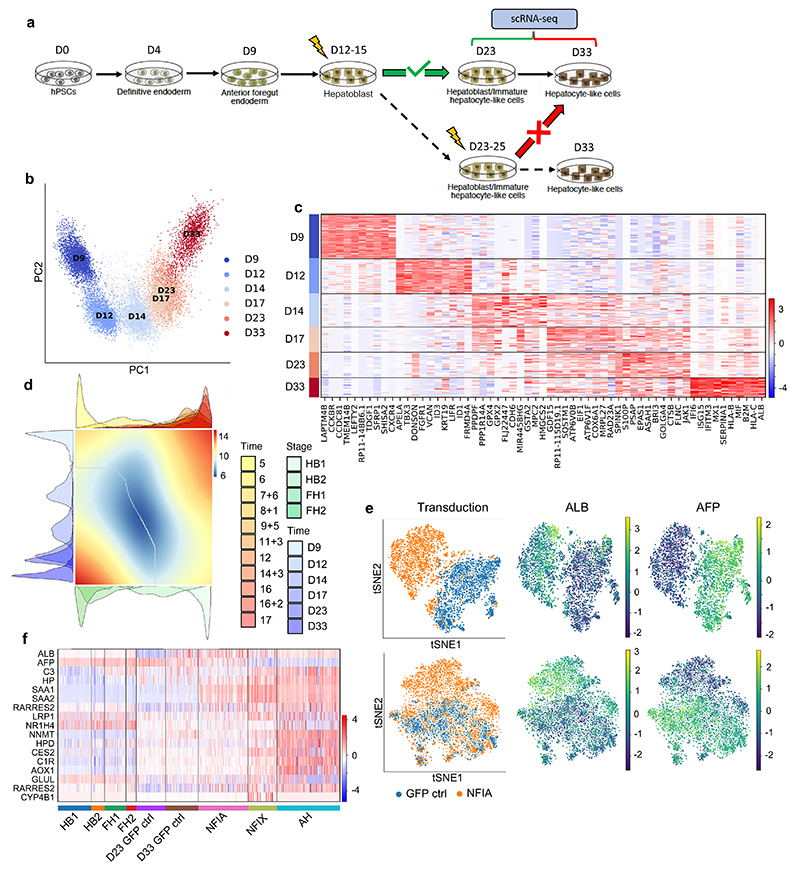
Fig. 7. Temporal overexpression of key transcription factors in hPSC-derived hepatocytes increases their similarity to adult primary hepatocytes.
a, Schematic representation of experimental processes to validate the functional transcription factors in hepatocyte differentiation. b, PCA showing the step-by-step differentiation of hPSCs into hepatocytes. D: day of differentiation (n=6 sequential differentiation timepoints, with one replicate sequenced per timepoint). c, Heatmap of top 10 differentially expressed genes (DEG) specific between each stage of differentiation; Wilcoxon-Rank-Sum test, z-score>10. d, Alignment of primary hepatocyte developmental trajectory to hiPSC differentiation using the CellAlign software; red colour shows regions of misalignment/dissimilarity, blue colour shows regions of close alignment/similarity (integrated scRNA-seq data from n=17 independent fetal livers ranging in age from 5 to 17 post-conceptional weeks and n=16 independent adult livers). e, UMAP visualization of HLCs transduced with transcription factors NFIX, NFIA and GFP (control) showing that TFs can increase ALB expression while decreasing the expression of the fetal marker AFP. f, Heatmap showing the acquisition of functional hepatocytes markers in transduced hepatocytes derived from hPSCs (n=1 sample sequenced per transduction). Heatmap colour scales show “gene expression [mean-scaled, log-normalized counts]”.

