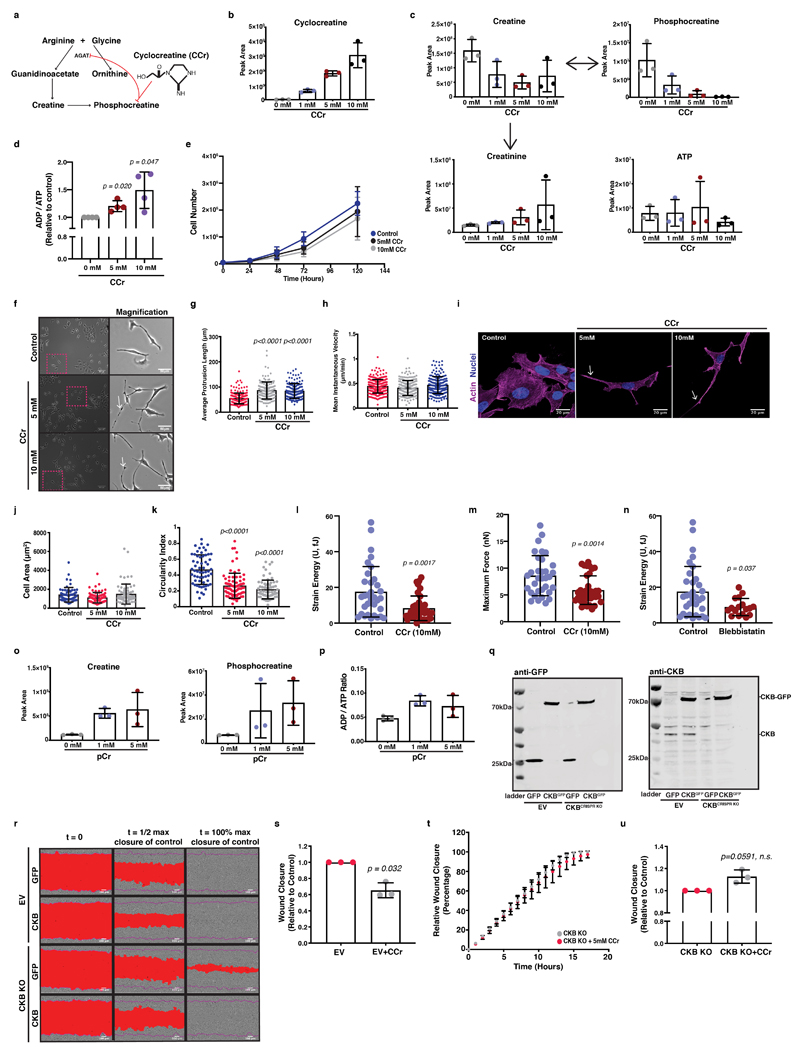
Extended Data Fig. 5. Creatine homeostasis facilitates collective migration of pancreatic cancer cells.
(a) CCr activity schematic.
(b) Ccr uptake by KPC cells. Values in b and c are mean ±SD from 3 biological replicates within the same day and representative of 2 independent experiments.
(c) Phosphocreatine circuit and ATP levels of (b).
(d) ADP to ATP ratio of (b). Mean ±SD from 4 independent experiments.
(e) Growth curves of (b). Mean ±SD from 3 independent experiments.
(f) Left; CCr-treated cells. Scale bars, 100μm. Right; Magnification of dashed boxes. White arrows; protrusions. Scale bars, 50μm.
(g) Average protrusion length from (f). Values are mean ±SD from n=206 control, n=145 5mM and n=142 10mM CCr-treated cells.
(h) Cell speed from (f). Mean ±SD from n=263 control, n=185 5mM and n=192 10mM CCr-treated cells from 3 independent experiments.
(i) Immunofluorescence of CCr-treated cells showing F-actin (magenta) and nuclei (blue). Scale bars, 20μm.
(j-k) Cell area (μm2) (j) and circularity index (k) from (i). Mean ±SD from n=60 control, n=78 5mM and n=69 10mM CCr-treated cells from 3 independent experiments.
(l-n) Total force (l), maximum force (m) of CCr-treated cells and strain energy of blebbistatin treated cells (n). Mean ±SD of n=33 control, n=36 CCr-treated and n=17 blebbistatin-treated cells from 3 independent experiments. Mann-Whitney U test.
(o) Creatine and phosphocreatine levels of control or pCr supplemented cells. Values in o and p are mean ±SD from 3 biological replicates within the same day.
(p) ADP/ATP ratio of (o).
(q) Control (EV) or CKBCRISPR KO cells expressing GFP or CKB-GFP were immunoblotted for GFP and CKB. Pictures representative of 3 independent experiments.
(r) Pictures of cells from (q) populating a wounded monolayer. Scale bars, 100μm.
(s) Relative wound closure of control or CCr-treated wild-type (EV) cells. Values in s, t, u are mean ±SD from 3 independent experiments.
(t-u) Relative wound closure (t) and relative closure at t1/2 of control (u) of control or CCr-treated CKBCRISPR KO cells.
In d,s,u: two-tailed one-sample t-test on LN transformed values.
In g,j,k: Kruskal-Wallis with Dunn’s multiple comparisons test.

