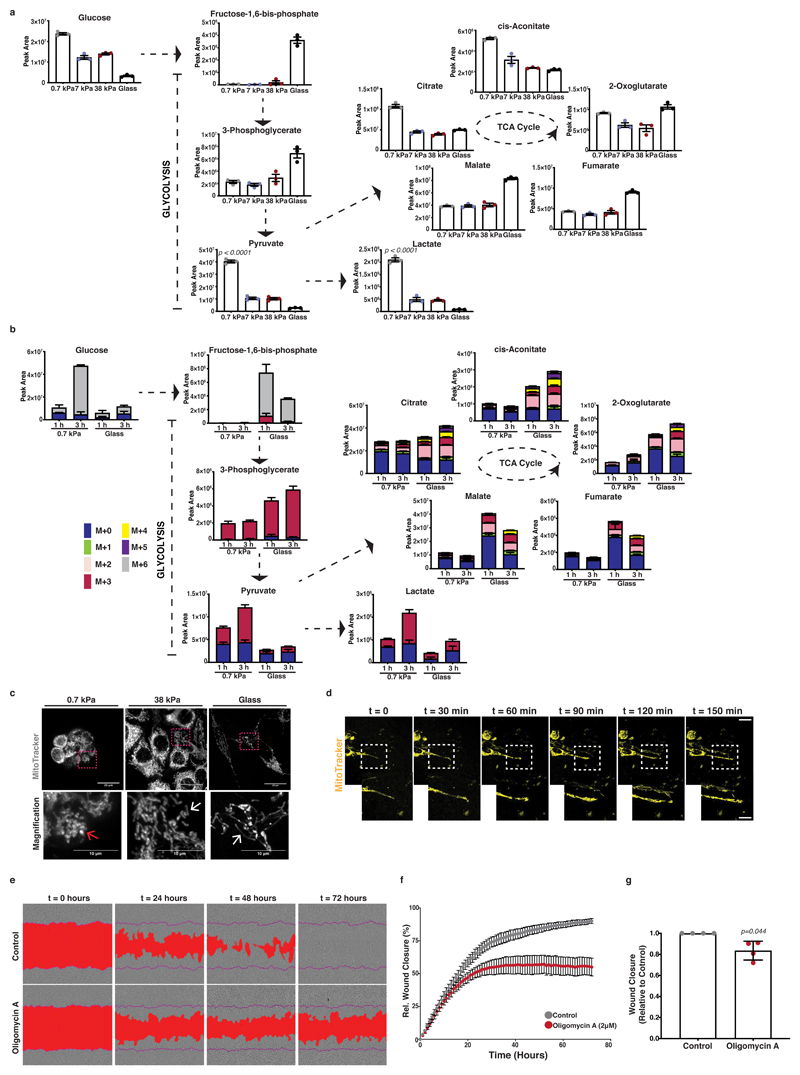
Figure 3. Mitochondrial dynamics and respiratory activity are induced by ECM mechanics in pancreatic cancer cells and support invasive behaviour.
In panels a-c, mouse KPC cells were cultured atop of 0.7-38kPa fibronectin-coated hydrogels and glass coverslips.
(a) Steady-state levels of glycolysis and TCA cycle intermediates of KPC cells cultured as indicated. Values are mean ± SD from 3 biological replicates within the same day. Statistical significance assessed by one-way ANOVA.
(b) Glucose-derived labelled carbon incorporation in glycolysis and TCA cycle intermediates of KPC cells cultured as indicated and supplemented with U-13C6-glucose for 1 and 3 hours. Values are mean ± SD from 3 biological replicates within the same day and representative from 3 independent experiments.
(c) Top; Maximum intensity projections of z-stack acquisitions of live KPC cells cultured as indicated showing labelled mitochondria (grey; MitoTracker). Scale bars, 20μm. Bottom; Magnification of the areas indicated by a dashed box. Scale bars, 10μm. White arrows highlight elongated and red arrows rounded mitochondria. Pictures representative of 3 independent experiments.
(d) Top; Representative pictures of KPC Matrigel-invading cells showing mitochondria labelling (yellow; Mitotracker) over 150 min. Scale bar, 20μm. Bottom right; Magnification of the areas indicated by a dashed box. Pictures representative of 3 independent experiments.
(e) Representative pictures of control or treated with oligomycin-A (2μM) PDAC-A cells invading 3D ECM. A mask over the wound area is annotated with red and a purple line indicates the initial wound area. Scale bars, 100μm. Pictures representative of 4 independent experiments.
(f) Wound closure over time from (e). Values are mean ± SD from 4 independent experiments. (g) Relative wound closure of (e) normalised at t1/2 wound closure of control. Values are mean ± SD from 4 independent experiments. Statistical significance assessed by two-tailed one-sample t-test on LN transformed values.

