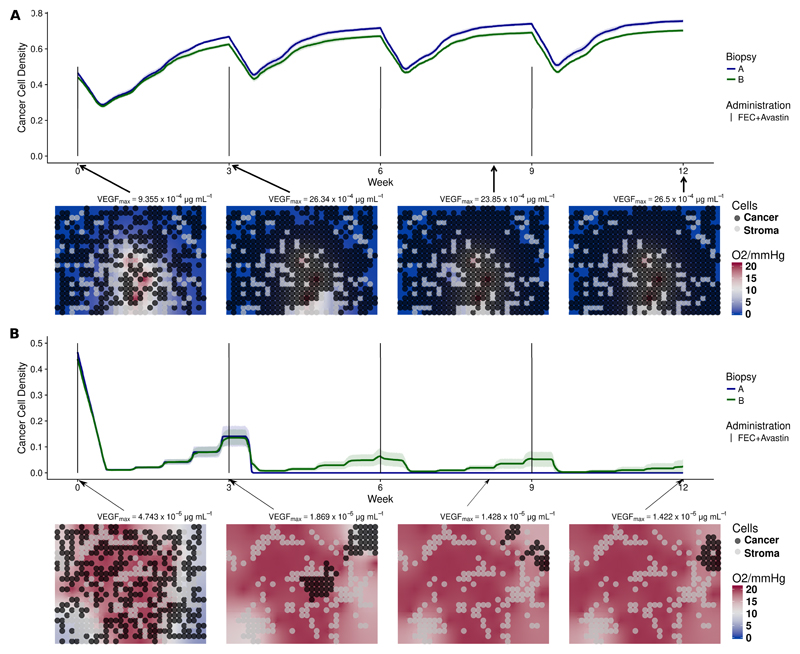
Figure 3.
(a) Simulations of NeoAva drug schedule in patient 3 under poorly-perfused condition. (b) Simulations of NeoAva drug schedule in patient 3 under well-perfused condition. Time evolution of cancer cell density for two different cell configurations, biopsy portions A and B, and drug schedules under two different perfusion profiles. Each line represents the average cancer cell density of 10 independent stochastic simulations. The corresponding color band indicates the 95% bootstrap confidence interval. Figure 3a represents the core of the tumor of patient 3, while lower panel of fig. 3b shows the peripheral spatial distribution of cancer and stroma cells for a representative simulation of the biopsy portion B for each patient. Background color represents oxygen pressure in mmHg.

