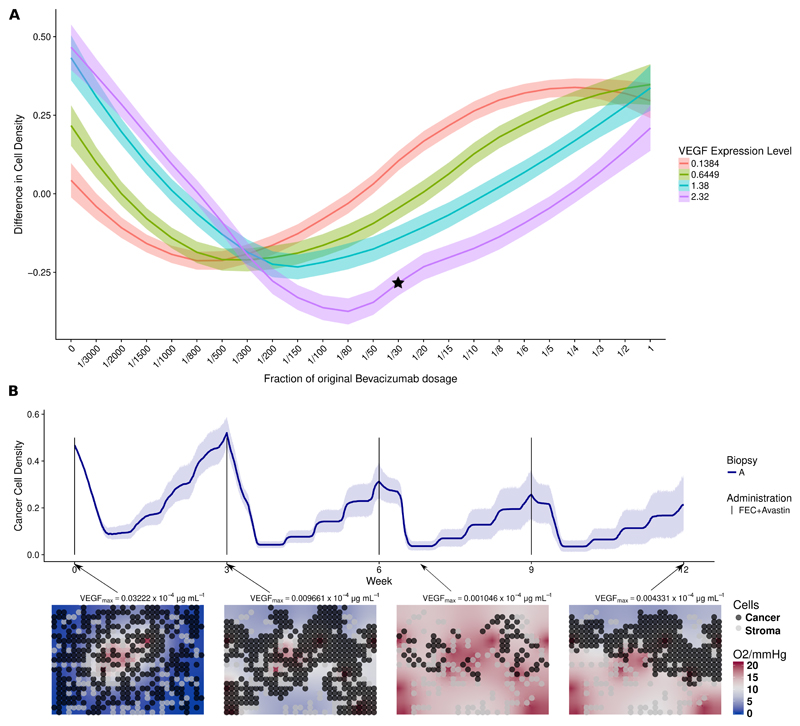
Figure 6.
(a) Effects of different bevacizumab schedule on Patient 3 with different estimated VEGF expression. (b) Simulation of an alternative drug schedule for Patient 3. In fig. 6a, the y-axis represents the simulated difference in cancer cell density between week 0 and week 12 under a 3-week administration interval. The x-axis indicates the hypothetical quantity of bevacizumab administered to the patient as fractions with respect to the full dose, corresponding to 15 mg/kg. Each colored band summarizes 10 independent simulations for patient 3 with VEGF expression from low to high given in the legend. These four expression levels correspond to those observed in our four patients. However, all other parameters are fixed as for Patient 3. In fig. 6b, we showed temporal dynamics of an alternative drug schedule providing better outcome. Solid lines represent the average cell density (n=10) of the alternative therapy obtained by administrating a reduced bevacizumab dosage of 0.5mg per kg body weight, equivalent of 3.33% of the dosage in the experimental arm alongside of chemotherapy following a 3-week interval. The corresponding simulation is labeled with a star in fig. 6a.

