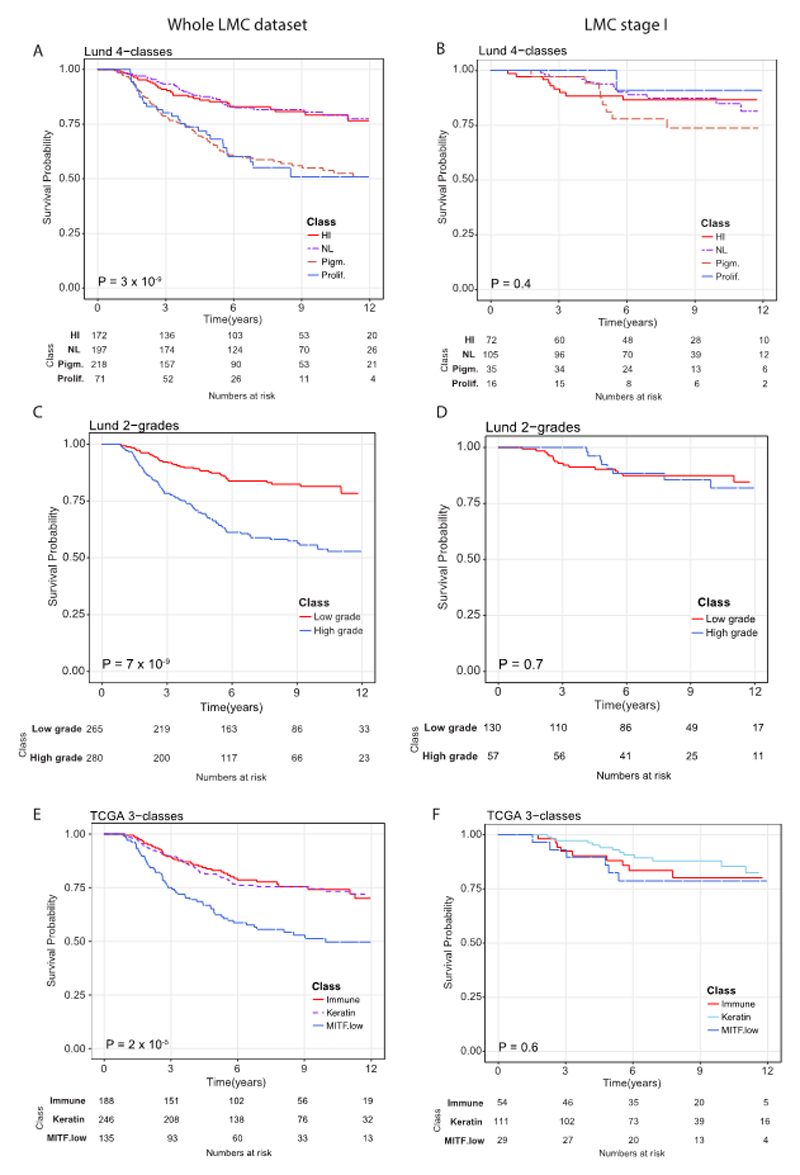
Figure 2.
Replicating Lund and TCGA signatures using LMC dataset. Kaplan-Meier plots showing the Melanoma-specific survival (MSS) for (A) Lund 4-classes (HI- high-immune, NL- normal-like, Pigm.- pigmentation, Prolif.- proliferative), (B) Lund 2-grades (low grade and high grade) and (C) TCGA 3-classes (immune, keratin, MITF low) across the whole LMC dataset. In LMC stage I subset, Kaplan-Meier plots showing the MSS for (D) Lund 4-classes, (E) Lund 2-grades, and (F) TCGA 3-classes. Pvalues are from log-rank test. Samples which could not be classified into any of the classes were not used in survival analysis.

