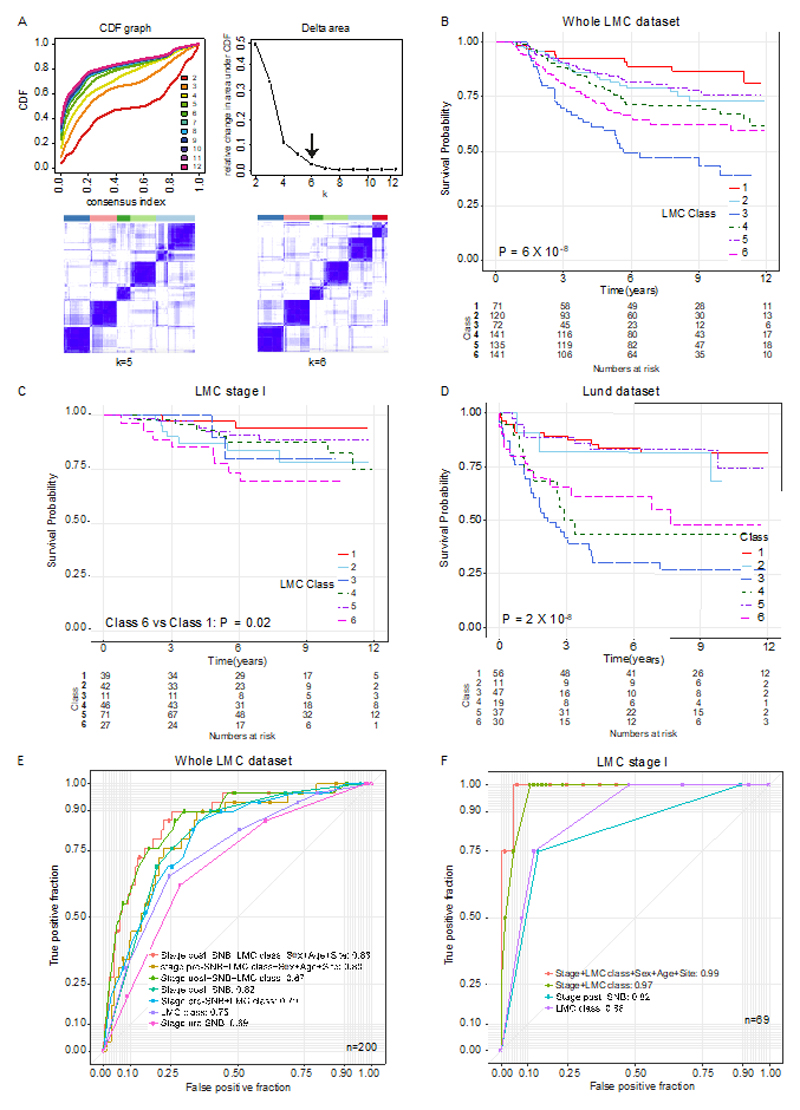
Figure 3. Defining LMC signature and its prognostic value.
(A) The area under the CDF and its relative change with increasing k. The delta area graph shows little variation at k=6. Heatmap of consensus matrices at k=5 and 6. The blue color indicates high consensus score and the white color indicates low consensus (B) Kaplan-Meier plot showing the MSS for the six classes in (B) the whole LMC dataset, (C) the LMC stage I, and (D) relapse-free survival in the Lund cohort (Pvalue from log-rank test, or Wald test for two-groups comparison). Seven mucosal tumors were excluded from analysis. (E) ROC curves comparing the prognostic value of the LMC signature to that of Sentinel Node Biopsy (SNB) in the whole dataset. The AUCs for LMC class+ stage pre-SNB and stage post-SNB were not significantly different (DeLong’s test P=0.7). (F) The ROC curve comparing prognostic value of LMC signature with SNB in the stage I pre-SNB group. All but one patient were stage IB pre-SNB, therefore AUC for LMC signature alone was compared to stage post-SNB and the difference was not significant (DeLong’s test P=0.7). The difference in AUCs between stage post-SNB alone and LMC class +stage post-SNB was also not significant (DeLong’s test P=0.1).

