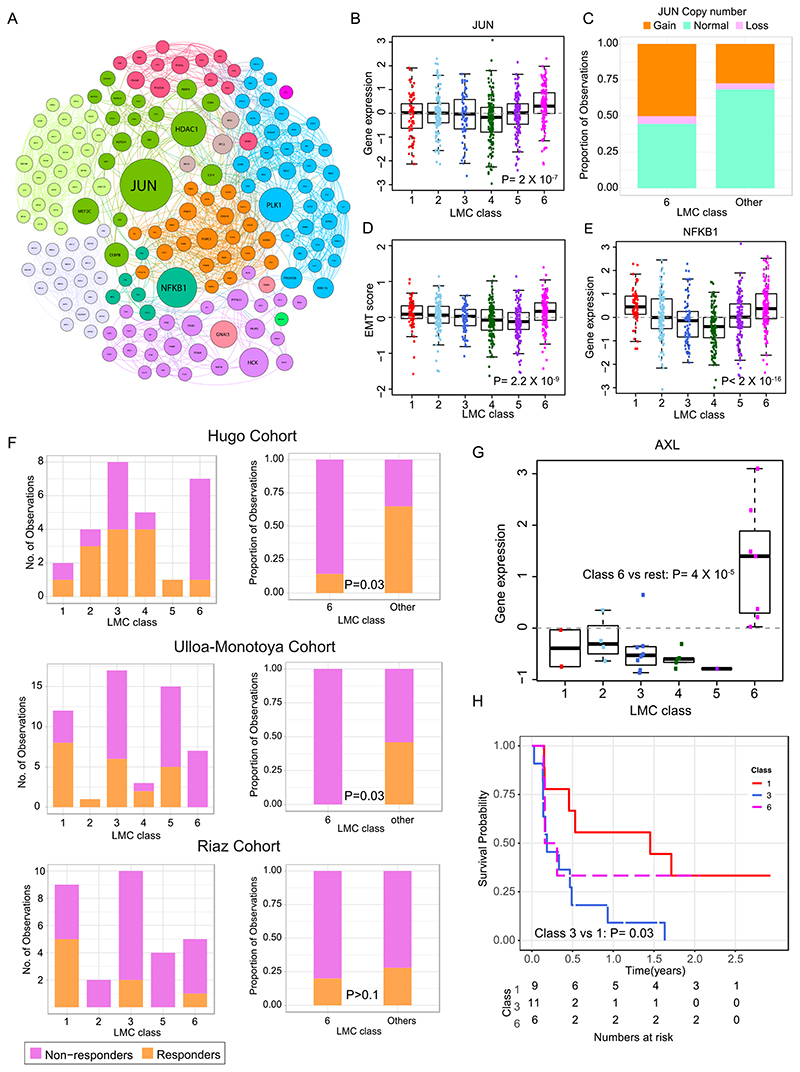
Figure 5. Biological characterization of LMC class 6 and association with response to immunotherapy.
(A) Network of upregulated genes in the LMC class 6 with key genes (highest betweenness centrality) shown as large circles. Sub-networks are shown in different colors. (B) Expression of JUN across the six LMC classes (Pvalue from Kruskal-Wallis test). (C) JUN copy number alterations in LMC class 6 vs other classes. (D) The 6-gene based EMT score in tumors across the six LMC classes (Pvalue from Kruskal-Wallis test). (E) The gene expression of NFKB1 across the 6 LMC classes (Pvalue from Kruskal-Wallis test). (F) The LMC classes association with response to immunotherapy in three cohorts (Pvalue from Fisher’s exact test). Patients in these cohorts were classified into the 6 LMC classes by the NCC method. (G) Expression of AXL across the six LMC classes in the Hugo Cohort dataset (Pvalue from Mann–Whitney U test). (H) Kaplan-Meier plot showing survival curves of LMC class 1, class 3, and class 6 in the Riaz Cohort. Other LMC classes had <5 samples and were excluded.

