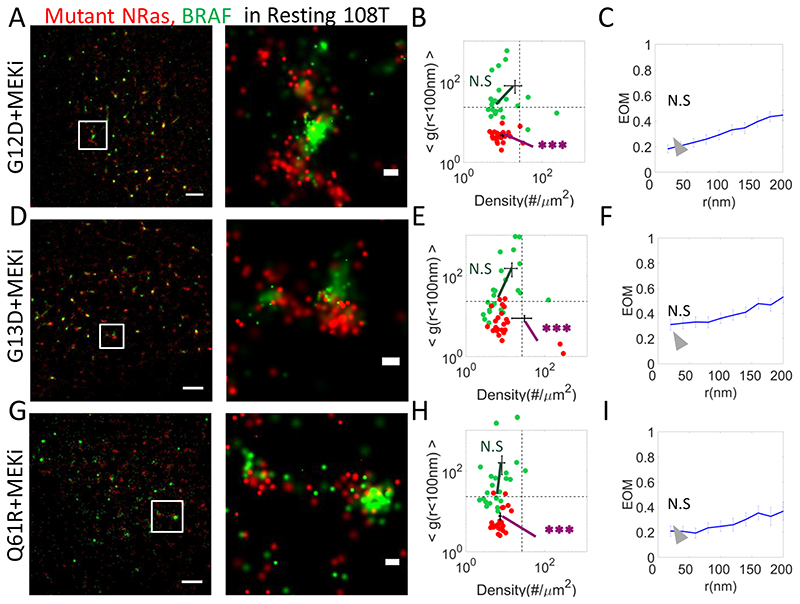
Fig. 5. Clinical inhibitors restore NRas-segregated BRAF clustering as in resting cells.
(A,D,G) Two-colour PALM imaging of resting 108T melanoma cells expressing PAmCherry-NRas mutants (G12D, G13, Q61R) and PAGFP-BRAF. Cells were seeded on the coverslip for 2 days and treated with MEKi 16h before fixation. Shown are representative cells (N=16, N=19, N=17). Bars – 2 μm (left) and 200 nm (right). (B,E,H) A two dimensional map of self-clustering (value of g(<100)) vs. protein density. Values are shown for individual cells as dots, either for BRAF (green) or mutant NRas (red). Note that both axes are logarithmic. Dashed black lines are guidelines for comparison of results with additional measurements. (C,F,I) The extent of mixing (EOM) of BRAF and mutant NRas (See Analyses in Methods). P-values relative to data in Fig. 1E: * < 0.05, ** < 0.01, *** < 0.005. P-values are summarized in Supplementary Table S4. Error bars in all relevant panels are SEM due to measurements on multiple cells.

