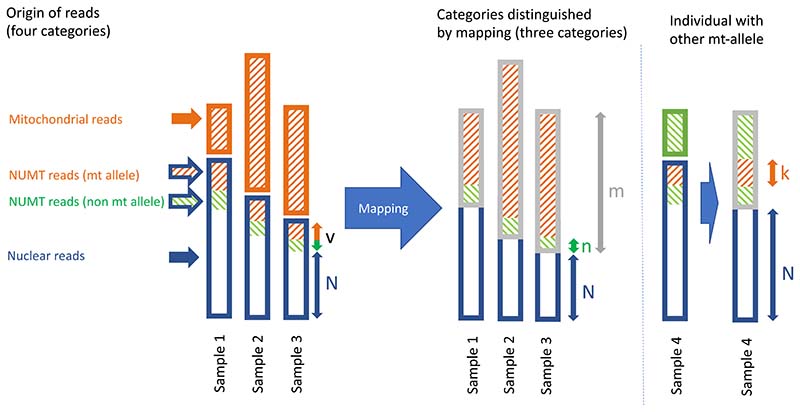
Figure 1.
A schematic showing the proportions of reads in four different categories. In samples 1, 2 and 3, the first two categories of reads cannot be distinguished by mapping because (organellar) mitochondrial reads and NUMT reads carry the same SNP allele (as an example, the A allele). Only the n reads carrying an alternative allele (T, G or C) can be classified as of NUMT origin. Sample 4 had another (T, green) allele in its organellar mitochondrial genome; hence, in this case, the k orange reads carrying the alternative alleles (A, G or C) can be classified as NUMTs. We wish to estimate the ratio of NUMTs compared to other nuclear DNA, v/N, but this ratio cannot be observed directly in any one of these samples. Fraction m denotes all reads with sequence similarity to the mitochondrial genome.

