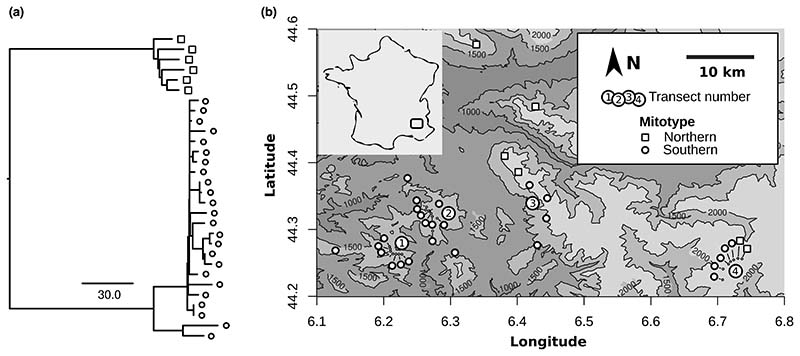
Figure 3. Sequence relationships and spatial distribution of grasshopper mitotypes.
(a) A dendrogram based on (true) mitochondrial sequence polymorphism between samples of the grasshopper Podisma pedestris. The scale bar indicates the number of substitutions per mitochondrial genome. The symbols match the legend in (b). (b) The locations of the sampling sites and the distribution of two diverged mitotypes. The inset shows the approximate position of the study area in France.

