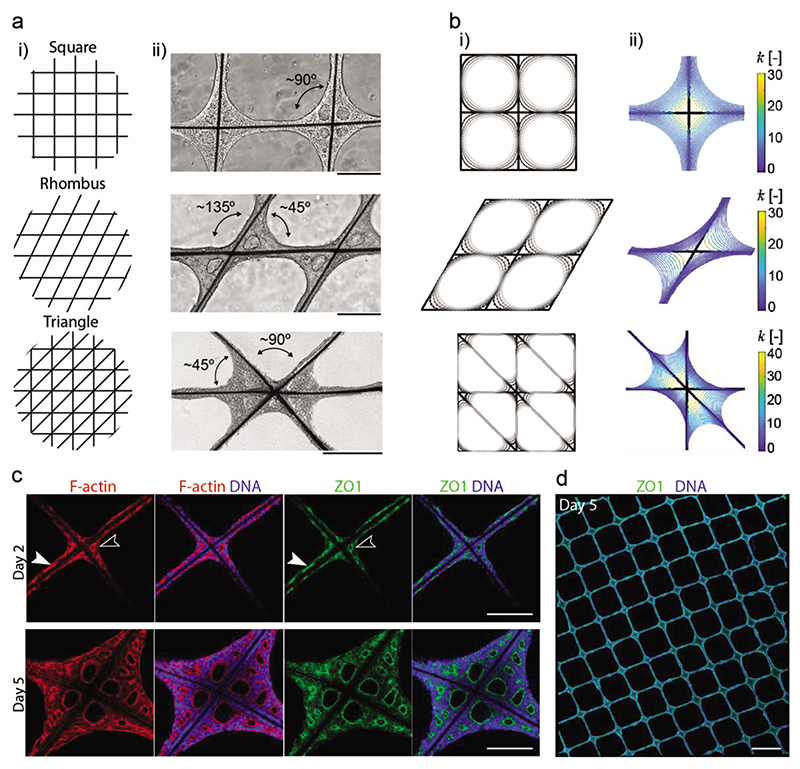
Figure 3. Scaffold geometry guides EB tissue formation.
a) Graphical illustrations showing the different scaffold geometry designs investigated (i), bright-field images on day 5 showing EB tissue morphology on the different scaffold geometries (ii) on square grids that create four 90° angles as labeled in the bright-field image, rhombus grids that create two major angles of ≈135°and ≈45°, and triangle grids that create two major angles of ≈90°and ≈45°. b) Curve shortening flow models of EB tissue growth on scaffolds. Tissue growth evolution is modeled on: (i) square, rhombus, and triangle grid scaffolds, with lighter gray representing later time points, and (ii) evolution of normalized line curvature of the tissue interface. The key represents curvature. c) Characterization of lumen formation on square grid scaffolds at day 2 and day 5 by staining for F-actin (phalloidin), and immunostaining with apical protein marker ZO1 and nuclei (DAPI). A representative example of lumen emergence at the scaffold intersections is shown on day 2 (white line arrowheads) and at the scaffold walls (solid white arrowheads). The bottom row shows the matured tissue comprising the lumen at day 5 (n = minimum of 3 tissue nodes from 1 or 2 independent scaffolds). Scale bar: 200 μm. d) Tiled confocal fluorescence microscopy image of an immunostained scaffold sample with the apical protein marker ZO1, and counterstained with DAPI. Scale bar: 1 mm.

