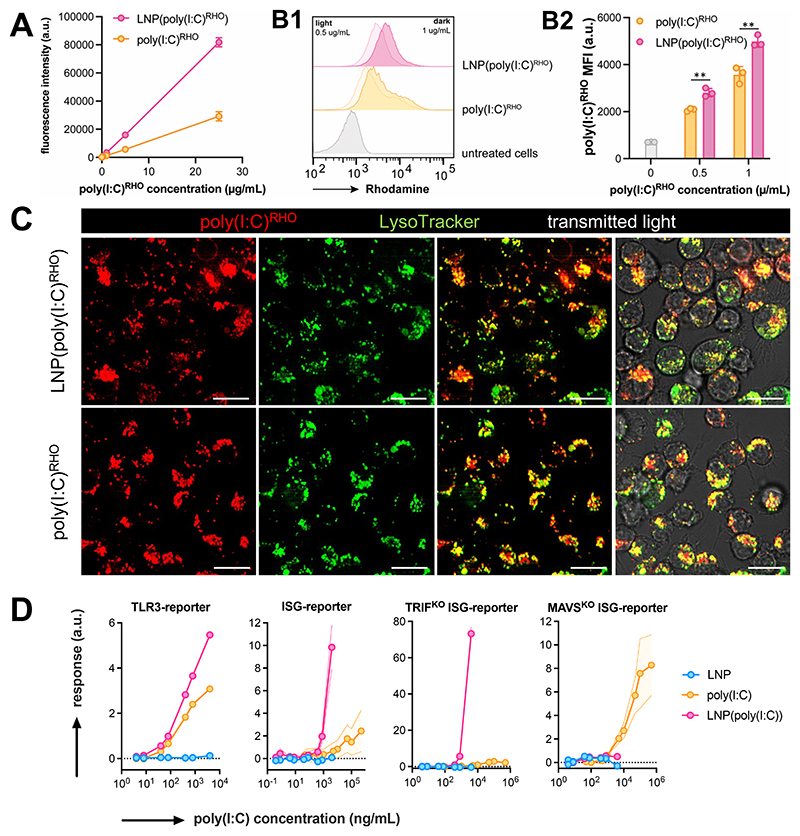
Figure 4. In vitro characterization of LNP(poly(I:C)).
(A) Fluorescence emission intensity (λex: 535 nm/λem: 670 nm) of poly(I:C)RHO and LNP(poly(I:C)RHO) (n=2, mean+SD). (B) Flow cytometry analysis of DC2.4 pulsed with LNP(poly(I:C)RHO) and unformulated soluble poly(I:C)RHO, (B1) histograms and (B2) corresponding MFI values. (n=3, mean ± SD ; t-test **: p < 0.01). (B) Confocal microscopy images of DC2.4 cells treated with LNP(poly(I:C)RHO) and poly(I:C)RHO. Cells were counterstained with LysoTrackerGreen. Scale bar represents 30 micron. (C) Innate immune activation by LNP(poly(I:C)) and poly(I:C) in TLR3- and ISG-reporter cell lines (n=6, mean ± SD). Note that a soluble, unformulated, poly(I:C) could be tested at concentrations that cannot be reached for LNP(poly(I:C)).

