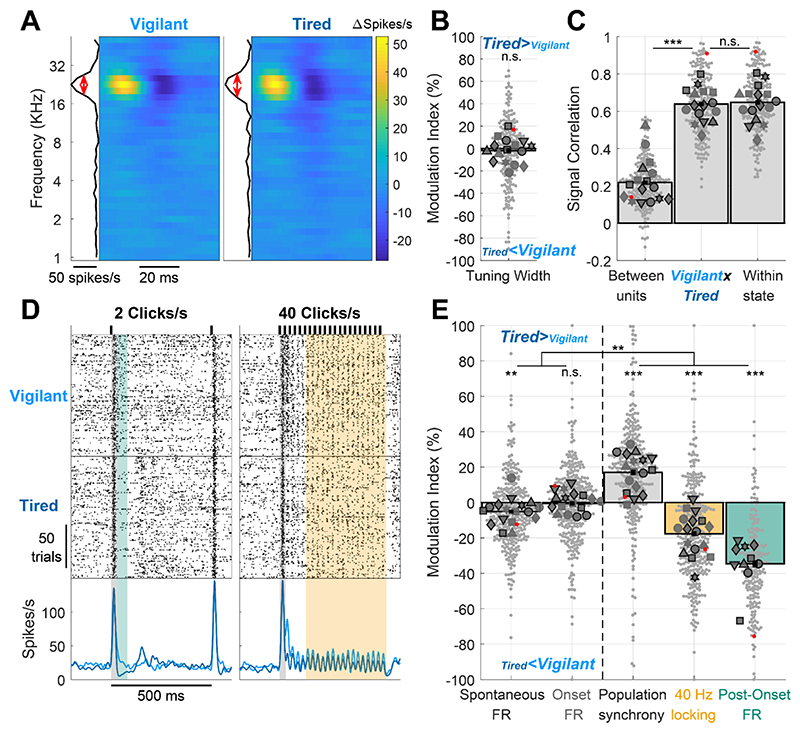
Figure 2. Auditory cortex processing during sleep deprivation.
A) Representative spectro-temporal receptive field (STRF) of a unit in auditory cortex showing preserved frequency tuning across Vigilant and Tired conditions (left and right, respectively). B) Modulation of frequency tuning width (Tired vs. Vigilant conditions) for all tuned units (n=198 out of 496 total) and sessions (n=16). C) Signal correlations of frequency tuning across the entire dataset between different units in the same session (left bar, benchmark for min. correlation), between Vigilant and Tired conditions of the same individual units (middle bar) and between 1st and 2nd halves of trials in the same condition for the same individual units (right bar, benchmark for max. correlation). Note that signal correlations are nearly as high across Vigilant and Tired conditions as they are within the same condition. D) Representative raster and peri-stimulus time histogram (PSTH) for a unit in response to 2 and 40 clicks/s click trains (left and right, respectively). Gray shading marks the onset response [0-30]ms period. Green shading represents the post-onset [30-80]ms period where firing rate was especially attenuated during the Tired condition. Yellow shading represents the [130-530]ms period where sustained locking to the 40 click/s train was attenuated during the Tired condition. E) Modulation of activity/response features between Tired and Vigilant conditions across units (n=327) and sessions (n=17). Features (left to right) denote: spontaneous firing rate (FR), onset response FR, population synchrony, 40-Hz locking and post onset FR. 2 click/s train were presented in 11 out of 19 sessions (‘auditory paradigm A’, n=199 units). For Panels B, C and E small gray markers represent individual units. large dark gray markers represent mean of all units in an individual session. Each marker shape represents sessions from an individual animal. Markers with/without black edges represent ‘auditory paradigm A’ and ‘auditory paradigm B’ sessions, respectively. Red dots point to the representative unit presented in panels A and D. Dashed vertical line separates features minimally/not significantly affected by condition (spontaneous FR and onset response FR; on left) vs. features significantly that are disrupted in the Tired condition (population synchrony, 40Hz locking, and post-onset FR; on right).

