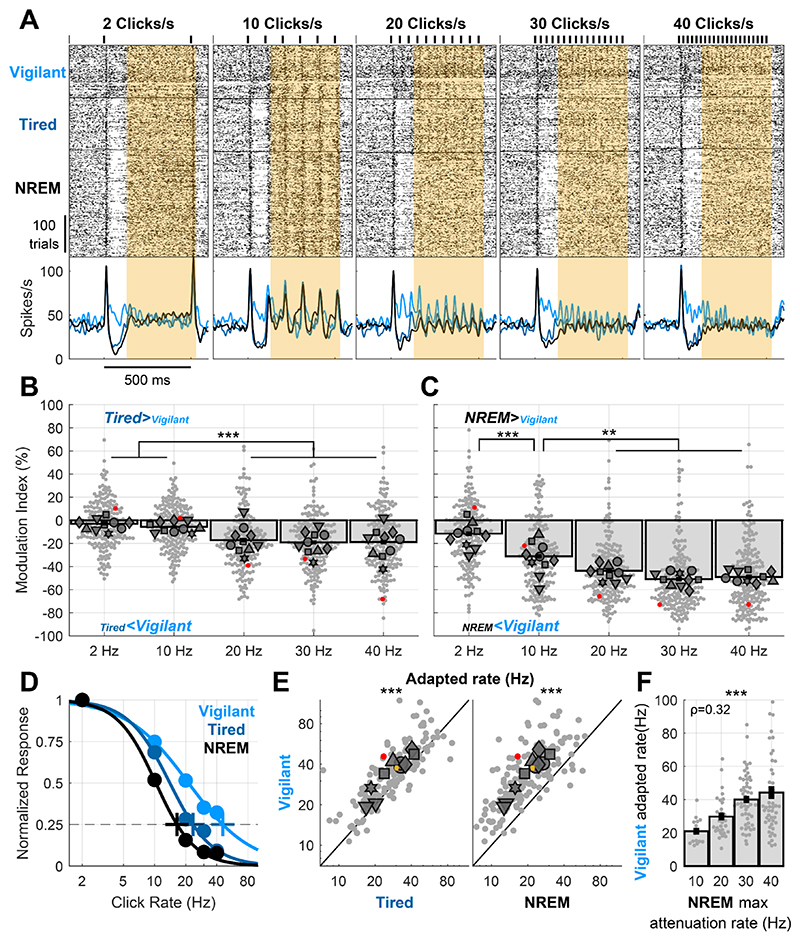
Figure 4. Recovery NREM sleep and sleep deprivation both entail a shift in sensory adaptation.
A) Representative unit raster and PSTH responses to 2, 10, 20, 30 and 40 clicks/s responses. Note that locking to click trains is progressively more disrupted in Tired/NREM sleep conditions with increasing click train rate. B) Modulation of locking to different click rates (Tired vs. Vigilant) for all units (n=197) and sessions (n=10). Locking to fast click trains (≥20 clicks/s) is significantly attenuated during sleep deprivation (‘Tired’). C) Same as B but comparing recovery NREM sleep to the Vigilant condition, showing increasingly stronger attenuation for faster click trains. D) Normalized locked responses in a representative unit (y-axis) as a function of click rate (x-axis) separately for Vigilant (cyan), Tired (blue), and recovery NREM sleep (green) conditions. Circles represent the observed locked response to each click rate in each condition. Thick traces connecting the circles represent the best sigmoid fit. Cross represents the estimated ‘adapted click-rate’, i.e. the click rate for which the normalized response would be 25% of maximum. E) Left: scatter plot of the ‘adapted click-rate’ for all units and sessions, comparing Vigilant (y-axis) with Tired conditions (y-axis); Right: same when comparing Vigilant (y-axis) with recovery NREM sleep (x-axis). Yellow cross represents mean±SEM across all units (n=150). F) observed click rate for which units demonstrate maximal attenuation between Vigilant and NREM sleep conditions (x-axis, Methods) vs. the estimated ‘adapted click-rate’ during the Vigilant condition (y-axis). Note that units with lower ‘adapted click-rate’ during wakefulness also show lower attenuation rates when comparing NREM sleep vs. Vigilant. For Panels B,C,E,F: small gray markers represent individual units. Large dark gray markers represent mean of all units in an individual session. Red dots point to the representative unit presented in panels A and D.

