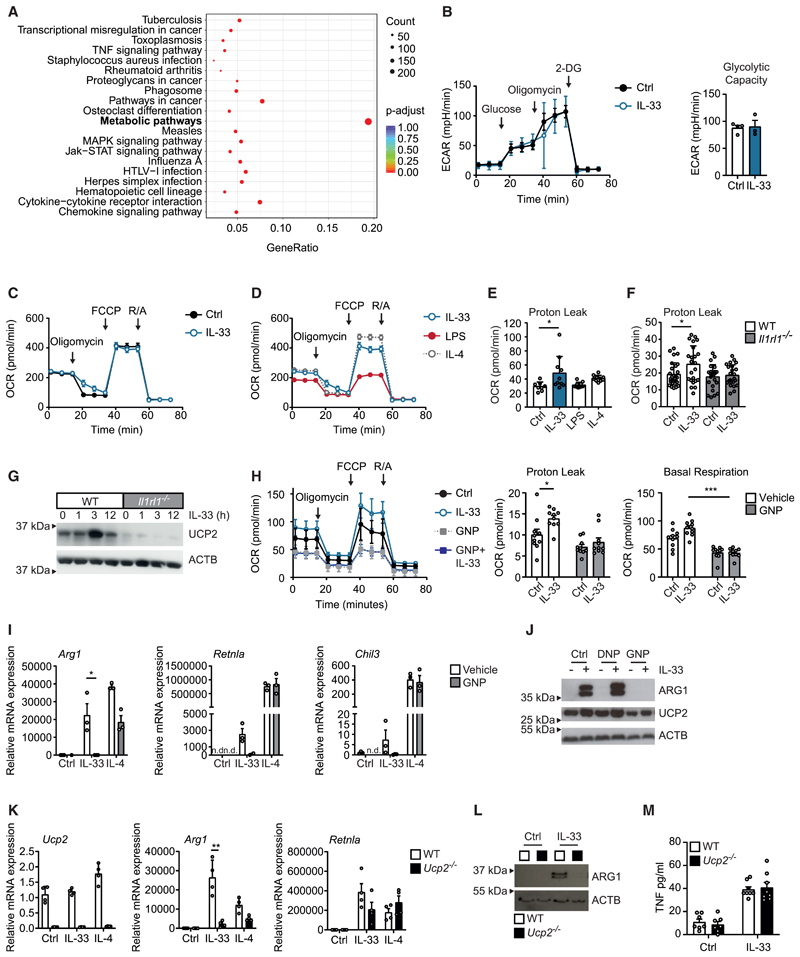
Figure 3. IL-33-induced mitochondrial rewiring promotes AAM differentiation.
(A) KEGG (Kyoto Encyclopedia of Genes and Genomes) enrichment analysis of bulk mRNA sequencing data comparing IL-33 (10 ng/mL for 36 h) and IL 4 (20 ng/mL for 36 h) treated BMDMs.
(B) Extracellular acidification rate (ECAR) of glycolysis stress test (extracellular flux assay) of BMDMs either vehicle treated (Ctrl) or treated with IL-33 (10 ng/mL for 6 h).
(C) Oxygen consumption rate (OCR) of Mito Stress Test (extracellular flux assay) of BMDMs either vehicle treated (Ctrl) or treated with IL-33 (10 ng/mL for 6 h). Data are representative of three individual experiments.
(D) OCR of BMDMs treated with IL-33 (10 ng/mL for 6 h), IL-4 (20 ng/mL for 6 h), or LPS (10 ng/mL for 6 h).
(E) Proton leak calculated from Mito Stress Test (extracellular flux assay) of BMDMs either vehicle treated (Ctrl) or treated with IL-33 (10 ng/mL for 6 h), IL-4 (20 ng/ mL for 6 h), or LPS (10 ng/mL for 6 h).
(F) Proton leak calculated from Mito Stress Test (extracellular flux assay) of WT or Il1rl1−/− BMDMs either vehicle treated (Ctrl) or treated with IL-33 (10 ng/mL for 6 h).
(G) Western blot of UCP2 protein from mitochondrial fractions of WT or Il1rl1−/− BMDMs treated with IL 33 (10 ng/mL) for the indicated time points. Data are representative of three individual experiments.
(H) Oxygen consumption rate (OCR) of Mito Stress Test (extracellular flux assay) of BMDMs vehicle treated (Ctrl) or treated with IL-33 (10 ng/mL for 24 h) and/or GNP (100 μM for 24 h). Proton leak and basal respiratory capacity calculated from Mito Stress Test.
(I and J) Quantitative real-time PCR (I) and western blot (J) showing mRNA and protein expression of indicated markers of alternative activation (Arg1, Retnla, Chil3, ARG1) in BMDMs treated with IL-33 (10 ng/mL for 5 days), IL-4 (20 ng/mL for 5 days), genipin (GNP; 100 μM for 5 days), and/or DNP (50 μM for 5 days). Data are representative of three individual experiments.
(K–M) Quantitative real-time PCR (K), western blot (L), and ELISA (M) showing mRNA and protein expression of indicated markers of alternative activation (Arg1, Retnla, Chil3, ARG1), Ucp2, and TNF in WT and Ucp2−/− BMDMs upon stimulation with vehicle (Ctrl) or IL-33 (10 ng/mL for 5 days). Data are representative of three individual experiments.
Data are presented as mean + SEM. *p < 0.05, **p < 0.01, and ***p < 0.001. See also Figure S3.

