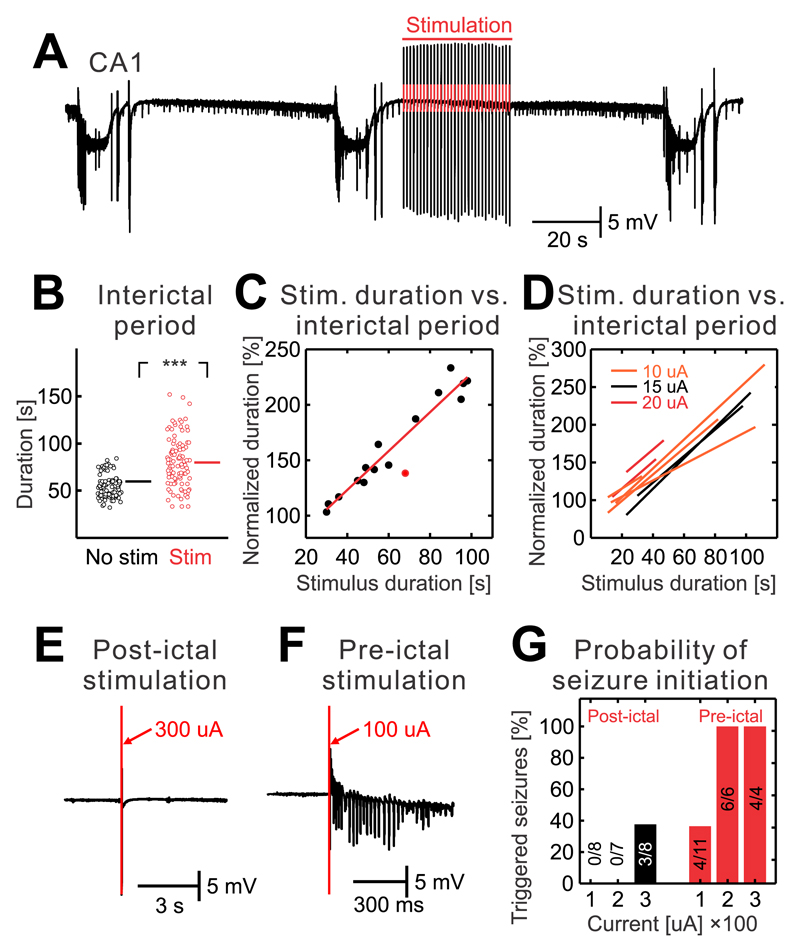
Figure 6. State-dependent effect of interictal perturbations.
(a) Seizures and interictal period without stimulation was followed by the interictal period when the train of Schaffer collateral stimulations (1 Hz) was delivered during early stages of the interictal period. The stimulation extended the duration of the interictal period. (b) The duration of interictal periods with and without early stimulations (n=213/8 stimulations/slices; two-sided Mann-Whitney-Wilcoxon U test, U=2180, P=0.000). (c) Example of an individual slice that was stimulated with an intensity of 15 μA. The results demonstrate that the duration of the interictal period increases with the duration of stimulation. Data were fitted with a regression curve. The red dot marks a stimulation, which was associated with a seizure. (d) Regression curves for individual slices and current intensities of the stimulation demonstrate the seizure-delaying effect of interictal perturbations. (e) A single stimulus of stronger intensity (300 μA) delivered during early stage of interictal period fails to induce seizures. (f) A stimulus of lower intensity (100 μA) delivered during the late phase of the interictal period has the capacity to initiate a seizure. (g) The probability of a seizure initiating effect of the stimulations delivered during the early and late stages of the interictal period (n=3 slices). During the early stages (black bars) only strong stimulations are capable of initiating seizures. During the later stage of the interictal period (red bars) both weak and strong stimulations have a higher probability to initiate seizure. Lines and error bars represent mean and s.e.m respectively; ***P ≤ 0.001.

