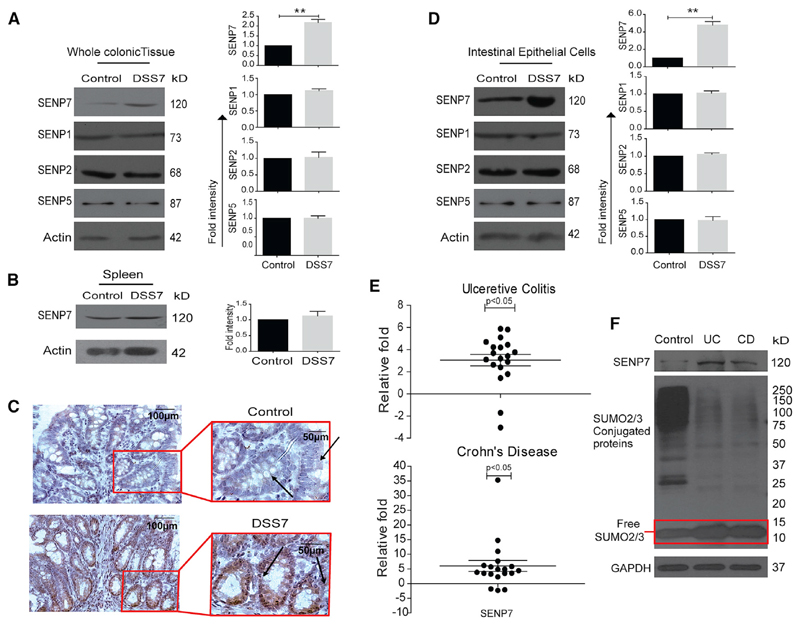
Figure 1. Upregulated Expression of deSUMOylase SENP7 in Colonic Epithelial Cells in Murine and Human Colitis.
(A) Expression analysis of SENP7, SENP1, SENP2, and SENP5 by immunoblotting from whole colonic tissue lysates of control mice and mice treated with 2.5% DSS for 7 days (DSS7) (n = 3). Densitometric analysis of expression by means + SEM from three independent experiments for the indicated protein (right panel). The quantitation panel was normalized to loading control (β actin) to calculate the fold intensity.
(B) Immunoblots from lysates of spleen showing no change in SENP7 expression. Densitometric analysis of values (means + SEM) from three independent experiments were plotted (right panel).
(C) Immunohistochemistry of SENP7 (brown color) from colonic sections (5 μm) showing expression in intestinal columnar epithelium and crypts (marked with arrows) and cell nuclei (blue color). Scale bar, 100 μm. Inset shows zoomed areas of the image.
(D) Immunoblot of indicated proteins from isolated intestinal epithelial cells lysates of control and DSS-treated mice (DSS7). Densitometric analysis of values (means + SEM) from three independent experiments were plotted (right panel).
(E) qRT-PCR-based fold-change expression of SENP7 from human CD (n = 19) and UC (n = 19) patient colonic epithelium relative to average control values (baseline zero) (n = 19) are plotted. Each dot represents data from one sample. GAPDH was used for normalization. Statistical testing was performed between the control and IBD (UC and CD) group using a Mann-Whitney U test (p value as indicated).
(F) SUMO2/3 immunoblot of lysates of human patient samples. GAPDH was used as a loading control. **p < 0.01.
See also Figure S1.

