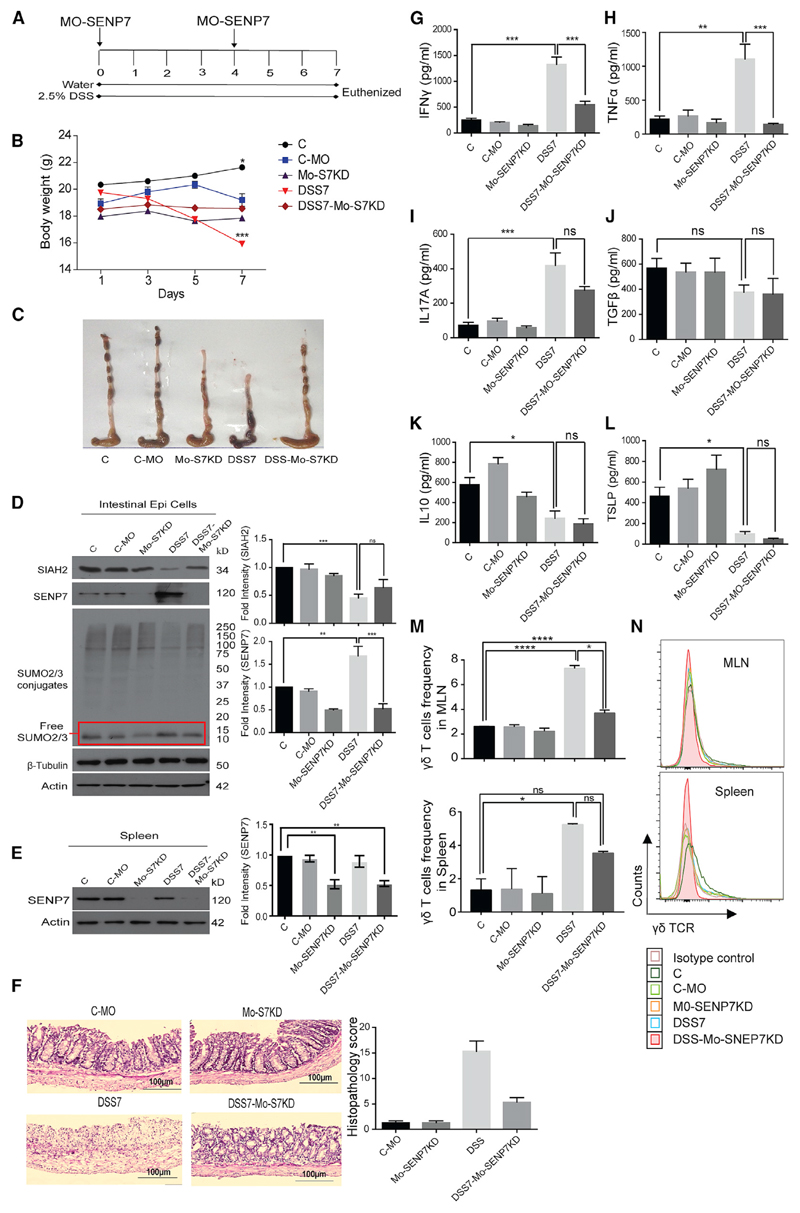
Figure 4. SENP7 Suppression Ameliorates DSS Induced Colitis.
(A) Schematic representation of knockdown of SENP7 in mice. SENP7 morpholino was injected intraperitoneally (day 0) and on day 4, followed by euthanasia and tissue isolation (n = 3).
(B) Mouse body weight (C, untreated control; C-MO, negative control; Mo-SENP7KD, SENP7 knockdown; DSS7, 7 days of DSS treatment; DSS7-Mo-SENP7KD, SENP7 knockdown with 7 days of DSS treatment).
(C) Gross morphology of the colon.
(D) Immunoblot showing protein expression of SIAH2, SENP7, and SUMO2/3 from isolated intestinal epithelial cells. Densitometry analysis by means + SEM from three independent experiments (right panel).
(E) Immunoblot showing SENP7 expression in splenocytes of the indicated group. Actin was used as a loading control in (D) and (E). Densitometry analysis by means + SEM from three independent experiments (right panel).
(F) Histopathology along with scores (lower panel) of colonic sections.
(G–L) ELISAs of mucosal isolates from the intestines of mice: IFN-γ (G), TNF-α (H), IL-17 (I), TGF-β (J), IL-10 (K), and TSLP (L) (n = 3 mice). Data are presented as mean + SEM.
(M) Bar graphs showing frequency of γδ T cells in presence of morpholino-mediated SENP7 knockdown in DSS and recovery groups in MLNs and spleen.
(N) Histogram overlay for γδ T frequency for the above groups. Statistical significance was calculated using a one-way ANOVA with Tukey’s posttest.
*p < 0.05; **p < 0.01; ***p < 0.001; ns, non-significant. See also Figures S3–S5.

