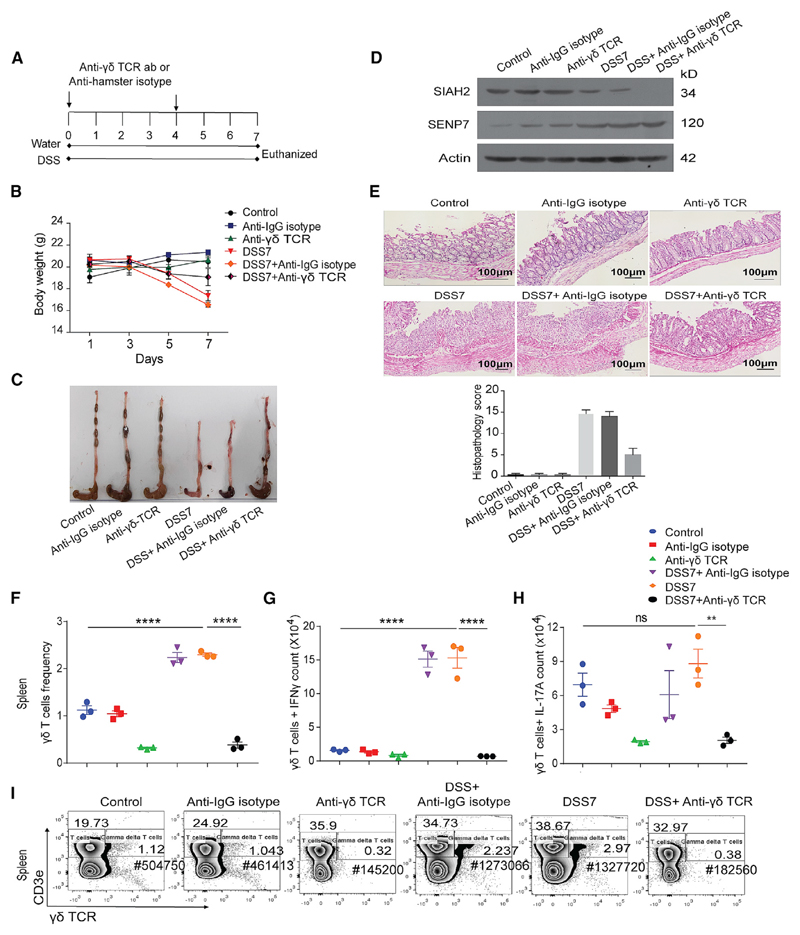
Figure 5. γδ T Cell Depletion Prevents DSS-Induced Colitis.
(A) Schematic of steps involved in γδ T cell depletion in mice. Anti-γδ TCR was injected intraperitoneally (two doses each of 0.5 mg/mouse) at the start of experiment (day 0) and at day 4, followed by euthanasia and tissue isolation (n = 3).
(B) Body weight of animals (Control, untreated control; Anti-IgG hamster isotype, mice given IgG isotype antibodies; anti-γδ TCR, γδ-T-cell-depleted mice; DSS7, 7 days of DSS treatment; DSS7 + anti-IgG isotype, non-targeting IgG isotype antibody with 7 days of DSS treatment; DSS7 + anti-γδ TCR, γδ-T-cell-depleted mice with 7 days of DSS treatment (n = 3).
(C) Gross morphology of mice colon of various categories.
(D) Immunoblot of SIAH2 and SENP7. β-Actin was used as a loading control.
(E) Histopathology of colonic cross-sections Scale bar, 100μm. Right: histopathology score calculated on the basis of inflammatory markers.
(F–I) Representative graph and contour plot showing immunophenotyping and intracellular cytokine staining of the indicated cell types from spleen (n = 3). For flow cytometry, cells were acquired on a BD FACS Canto, analyzed using FlowJo, and represented in the form of a graph (mean + SEM value). Statistical significance was calculated using a one-way ANOVA with Tukey’s posttest.
**p < 0.01; ****p < 0.001; ns, non-significant. See also Figure S6.

