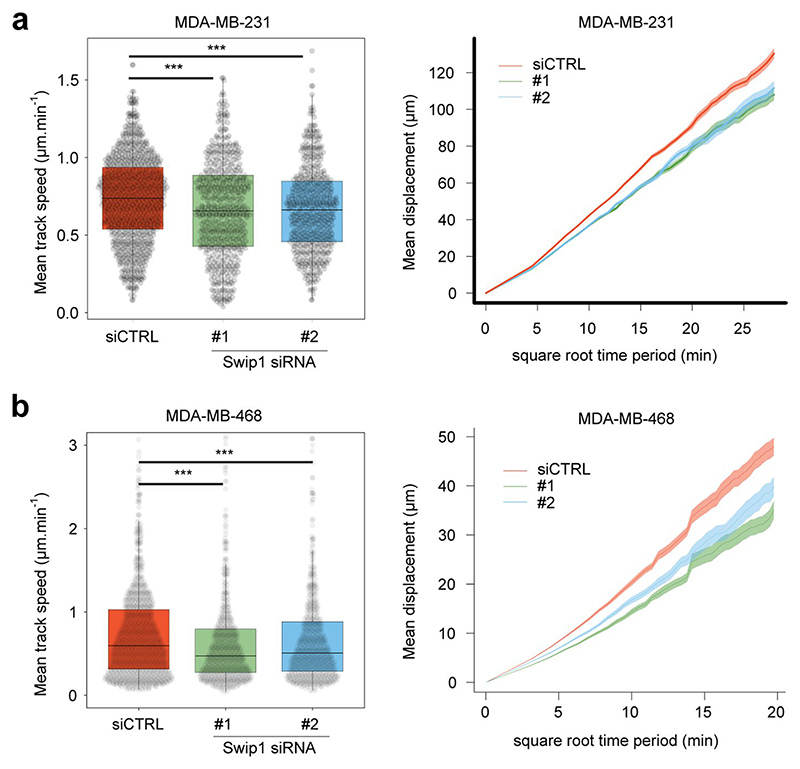
Extended Data fig. 9. Swip1 is required for random cell migration.
Random cell migration speed of MDA-MB-231 (a) and MDA-MB-468 (b) cells upon Swip1 silencing. In all cases, cells were labelled using sir-DNA and their migration behaviour recorded over time using a widefield microscope. Cell nuclei were automatically tracked using StarDist and TrackMate. Cell track speed and mean displacement plots are displayed. Boxplots display the median and quartiles of the data. Whiskers display the 2nd percentile and the 98th percentile. Mean displacement plots show mean values ± standard deviation. For all panels, P-values were determined using a randomization test, where n is the total number of cells pooled across 3 independent experiments, ***P = <0.001. Number of cells analysed over 3 independent experiments: MDA-MB-231, siCTRL, n = 869 cells; siSwip1 #1, n = 553 cells; siSwip1 #2, n = 506 cells; MDA-MB-468, siCTRL, n = 331 cells; siSwip1 #1, n = 206 cells; siSwip1 #2, n = 235 cells. Numerical source data are provided in Source data.

