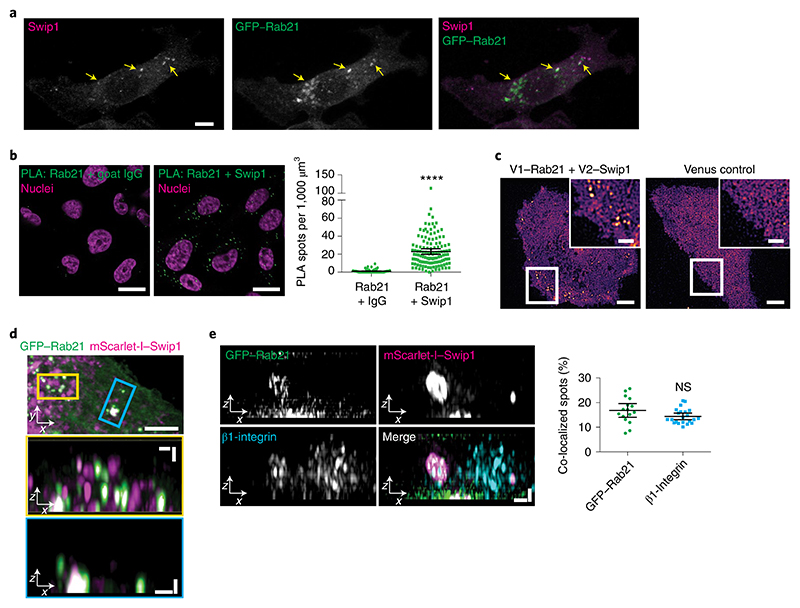
Fig. 2. Swip1 interacts with Rab21 and β1-integrin.
a, Representative MDA-MB-231 cell expressing GFP–Rab21 and immunostained for Swip1. The arrows point to regions of overlap between Swip1 and GFP–Rab21. Scale bar, 10 μm. The micrograph is representative of two independent experiments. b, Endogenous Rab21 and Swip1 are in close proximity in MDA-MB-231 cells. A PLA assay using the indicated antibodies (left) is quantified (right). Goat IgG was included as a negative control and nuclei were stained with 4,6-diamidino-2-phenylindole. Scale bars, 20 μm; n = 121 (Rab21–IgG) and 126 (Swip1–Rab21) cells were examined across three independent experiments. c, Representative TIRF microscopy images of live MDA-MB-231 cells expressing the BiFC constructs V1–Rab21 and V2–Swip1 or Venus alone as a control. Scale bars, 5 μm (main images) and 2 μm (insets). Three independent experiments were performed. d, MDA-MB-231 cells expressing mScarlet-I–Swip1 and GFP–Rab21 imaged using SIM. The blue and yellow squares highlight the regions of interest (ROI; top) in the x–y plane that are magnified in the x–z projections (middle and bottom; magnified views). Scale bars, 5 μm (top) and 1 μm (middle and bottom). Representative images of three independent experiments are shown. e, SIM x–z projections of MDA-MB-231 cells expressing mScarlet-I–Swip1, GFP–Rab21 and immunostained for β1-integrin (left) were quantified for co-localization with mScarlet-I–Swip1 (right). Each dot represents the co-localization fraction in one cell; n = 16 (GFP–Rab21) and 22 (β1-integrin) cells pooled from two independent experiments. Scale bars, 0.5 μm. b,e, Data are presented as the mean ± 95% confidence interval (CI). Statistical significance was assessed using a two-sided Mann–Whitney test; ****P < 0.0001; NS, not significant. Numerical source data are provided.

