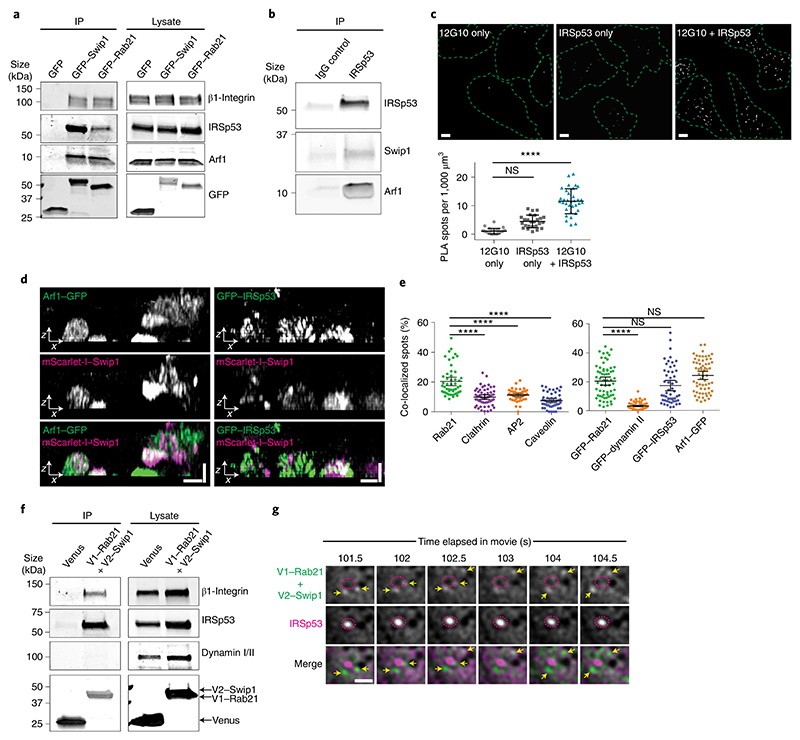
Fig. 3. Swip1 interacts with members of the CG pathway.
a, Representative immunoblots of GFP-Trap pulldowns from HEK293 cells transfected as indicated and blotted for GFP, endogenous IRSp53, Arf1 and β1-integrin. b, Representative immunoprecipitation, with control mouse IgG or anti-IRSp53, of MDA-MB-231 cell lysates probed for endogenous Swip1, IRSp53 and Arf1. c, Proximity ligation assay with the indicated antibodies alone (negative controls) and together to assess co-localization. Scale bars, 10 μm; n = 12 (12G10 only), 18 (IRSp53 only) and 28 (12G10 + IRSp53) cells analysed across two independent experiments. d, Representative SIM x–z projections of MDA-MB-231 cells expressing mScarlet-I–Swip1 and GFP–IRSp53 or GFP–Arf1. Scale bars, 0.8 μm. Three independent experiments were performed. e, MDA-MB-231 cells expressing mScarlet-I–Swip1 and immunostained for endocytic adaptor proteins (left) or transfected with the indicated GFP-tagged constructs (right) were imaged with SIM and quantified for co-localization with mScarlet-I–Swip1. Each dot represents the co-localization fraction in one cell; n = 50 (Rab21, AP2 and caveolin), 55 (clathrin), 63 (GFP–Rab21 and GFP–dynamin II), 53 (GFP–IRSp53) and 62 (GFP–Arf1) cells analysed, pooled from three independent experiments. c,e, Data are the mean ± 95% CI. Statistical significance was assessed using a two-sided Mann–Whitney test; ****P < 0.0001. f, Representative immunoblots of bimolecular complementation affinity purification pulldowns from MDA-MB-231 cells transiently transfected as indicated and blotted for GFP/Venus, endogenous IRSp53, dynamin I/II and β1-integrin. The GFP antibody recognizes both V1–Rab21 and V2–Swip1 (see also Extended Data Fig. 2b). a,b,f, Two independent experiments were performed. g, Representative TIRF microscopy BiFC images of live MDA-MB-231 cells expressing V1–Rab21 + V2–Swip1 and mCherry–IRSp53. The yellow arrows point to V1–Rab21 + V2–Swip1 puncta that travel towards mCherry–IRSp53 puncta (pink dashed circles) and then disappear from the TIRF plane. Scale bar, 1 μm. Representative images of two independent experiments are shown. IP, immunoprecipitation. Unprocessed blots and numerical source data are provided.

